30
/
AIzaSyAYiBZKx7MnpbEhh9jyipgxe19OcubqV5w
April 1, 2024
244939
Somalia
SOM
true
2
1
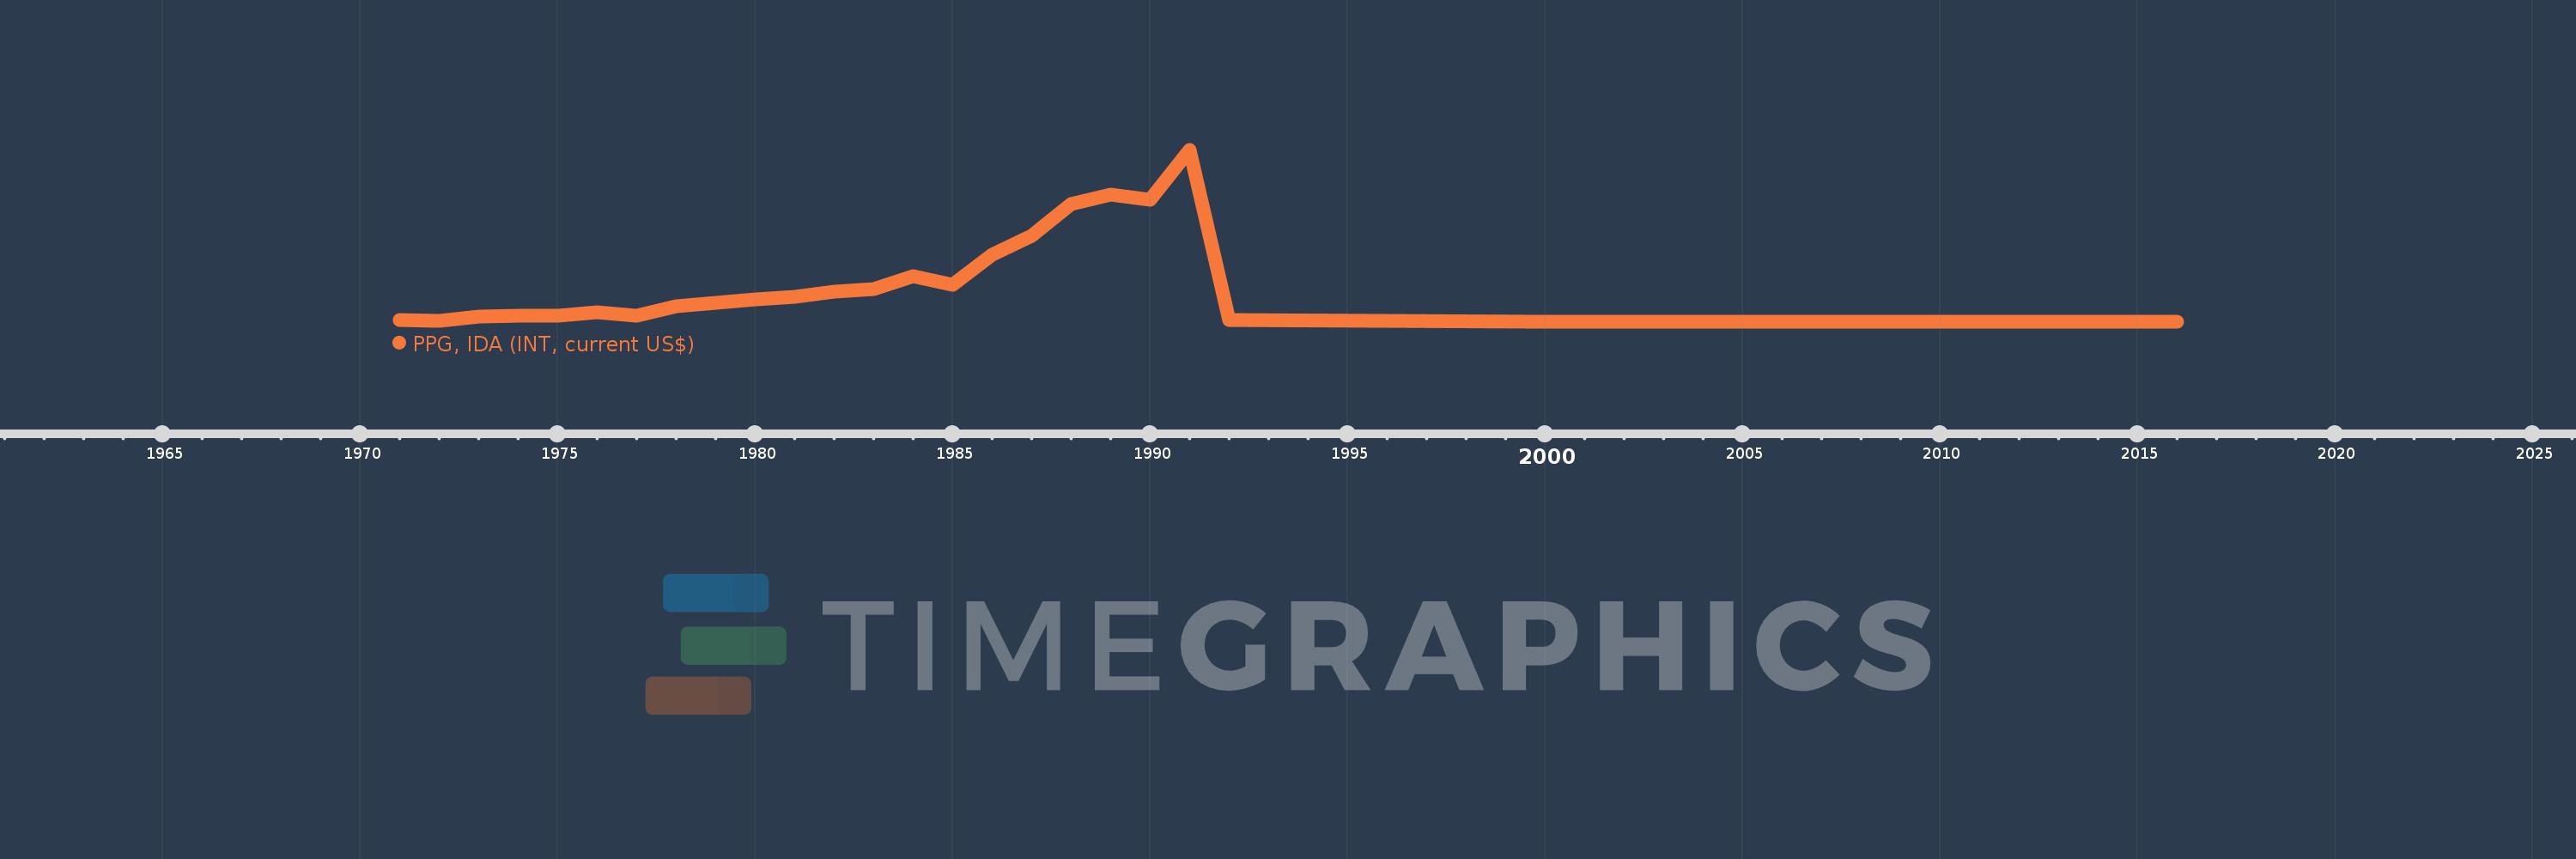
PPG, IDA (INT, current US$)
2016,2015,2014,2011,2010,2009,2008,2007,2006,2005,2004,2003,2002,2001,2000,1992,1991,1990,1989,1988,1987,1986,1985,1984,1983,1982,1981,1980,1979,1978,1977,1976,1975,1974,1973,1972,1971
