29
/
en
AIzaSyAYiBZKx7MnpbEhh9jyipgxe19OcubqV5w
April 1, 2024
199699
Mongolia
MNG
true
2
1
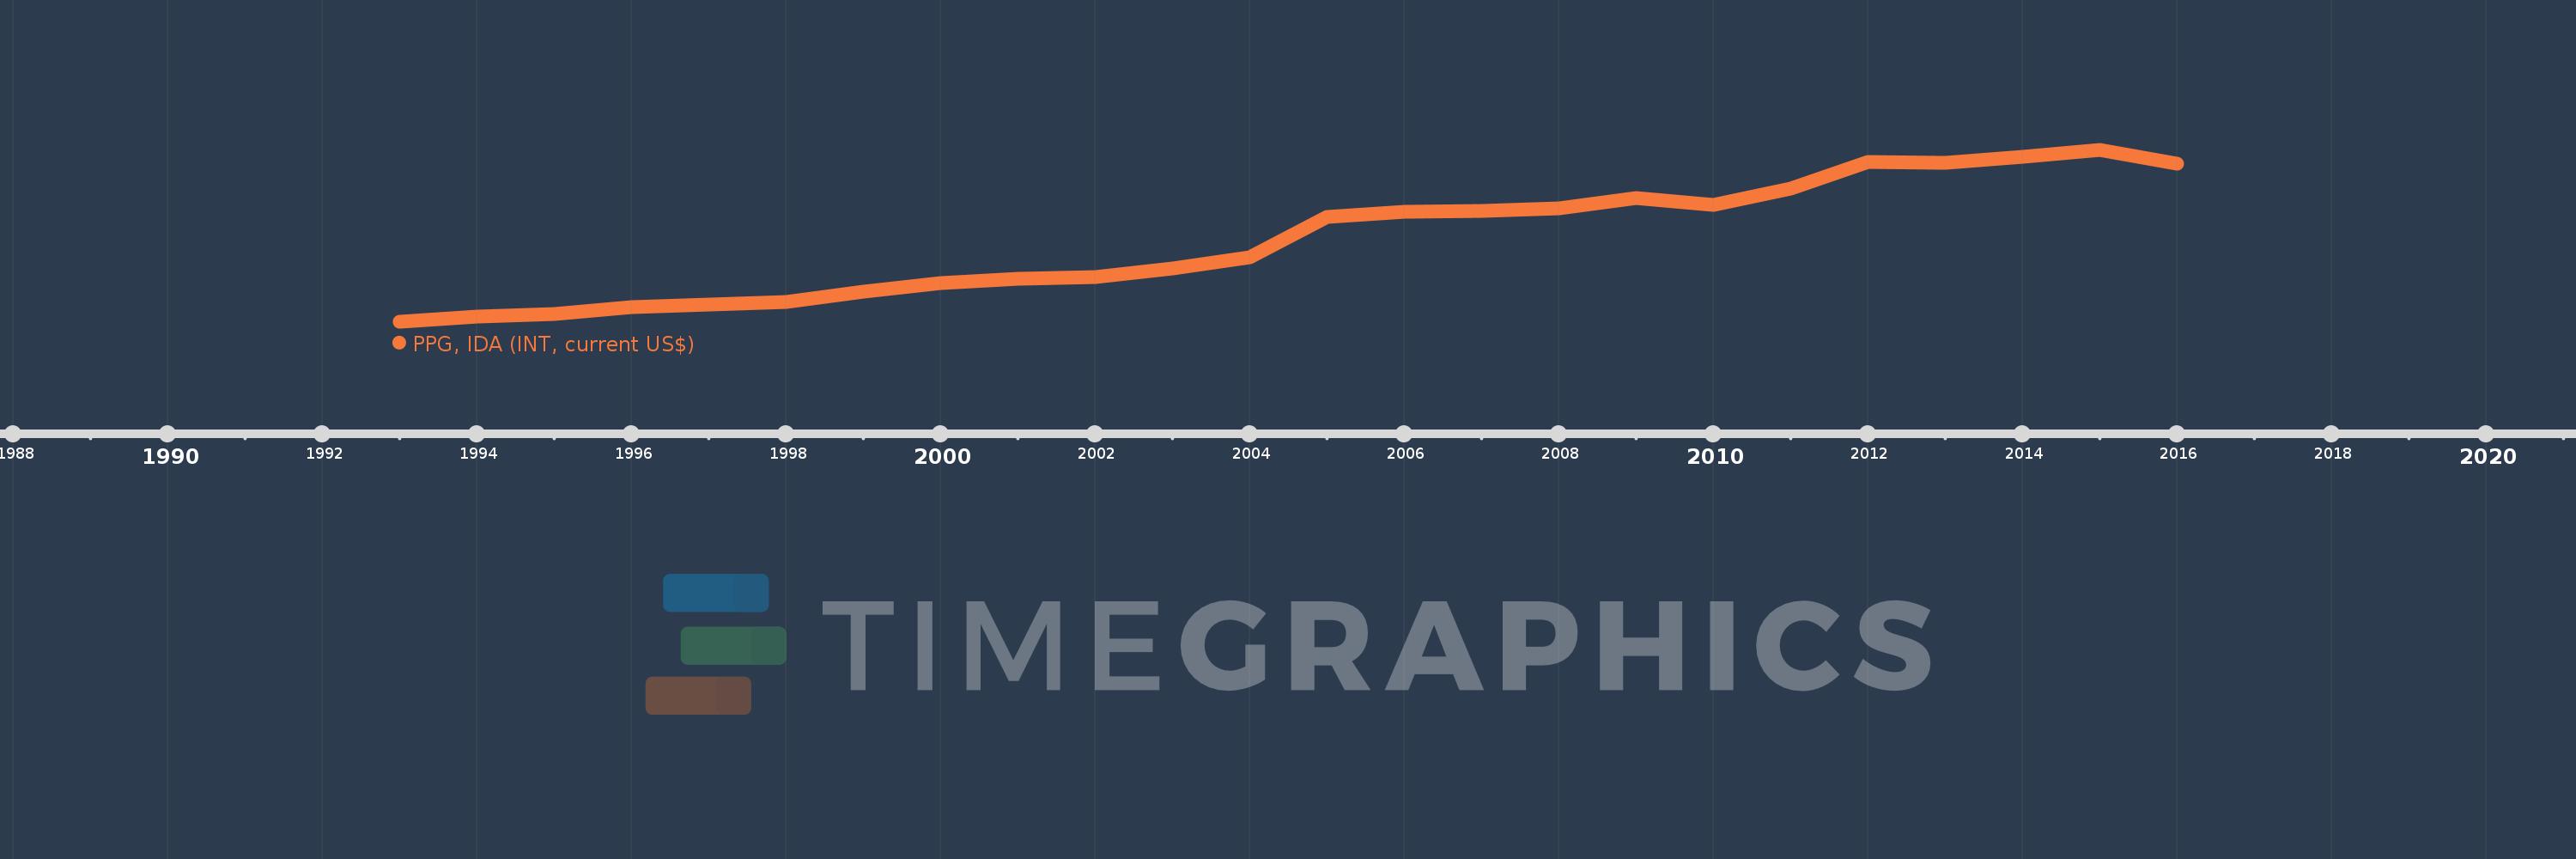
PPG, IDA (INT, current US$)
2016,2015,2014,2013,2012,2011,2010,2009,2008,2007,2006,2005,2004,2003,2002,2001,2000,1999,1998,1997,1996,1995,1994,1993
This statistics in other country:
Timeline:
This timeline shows a graph from 1993 to 2016 of Mongolia. No data until 1992. Number of actual observations by date: 24.
Source name:
World Development Indicators
Source organization:
World Bank, International Debt Statistics.
Categories, topics:
External Debt
Last updated:
apr 23, 2017
Indicators value changes by year
Minimum:
100.0K
jan 1, 1993
Maximum:
3.611 mln
jan 1, 2015
At the date of observation
Value
Absolute change
Change from previous value
jan 1, 1993
100.0K
+100.0K
0.0%
jan 1, 1994
206.0K
+106.0K
106.0%
jan 1, 1995
261.0K
+55.0K
26.7%
jan 1, 1996
397.0K
+136.0K
52.11%
jan 1, 1997
462.0K
+65.0K
16.37%
jan 1, 1998
514.0K
+52.0K
11.26%
jan 1, 1999
719.0K
+205.0K
39.88%
jan 1, 2000
902.0K
+183.0K
25.45%
jan 1, 2001
975.0K
+73.0K
8.09%
jan 1, 2002
1.018 mln
+43.0K
4.41%
jan 1, 2003
1.194 mln
+176.0K
17.29%
jan 1, 2004
1.415 mln
+221.0K
18.51%
jan 1, 2005
2.254 mln
+839.0K
59.29%
jan 1, 2006
2.358 mln
+104.0K
4.61%
jan 1, 2007
2.377 mln
+19.0K
0.81%
jan 1, 2008
2.43 mln
+53.0K
2.23%
jan 1, 2009
2.627 mln
+197.0K
8.11%
jan 1, 2010
2.499 mln
-128.0K
-4.87%
jan 1, 2011
2.834 mln
+335.0K
13.41%
jan 1, 2012
3.367 mln
+533.0K
18.81%
jan 1, 2013
3.356 mln
-11.0K
-0.33%
jan 1, 2014
3.478 mln
+122.0K
3.64%
jan 1, 2015
3.611 mln
+133.0K
3.82%
jan 1, 2016
3.344 mln
-267.0K
-7.39%
Ranking of countries by current statistics by years


Comments: