Download This statistics in other country:
Timeline:
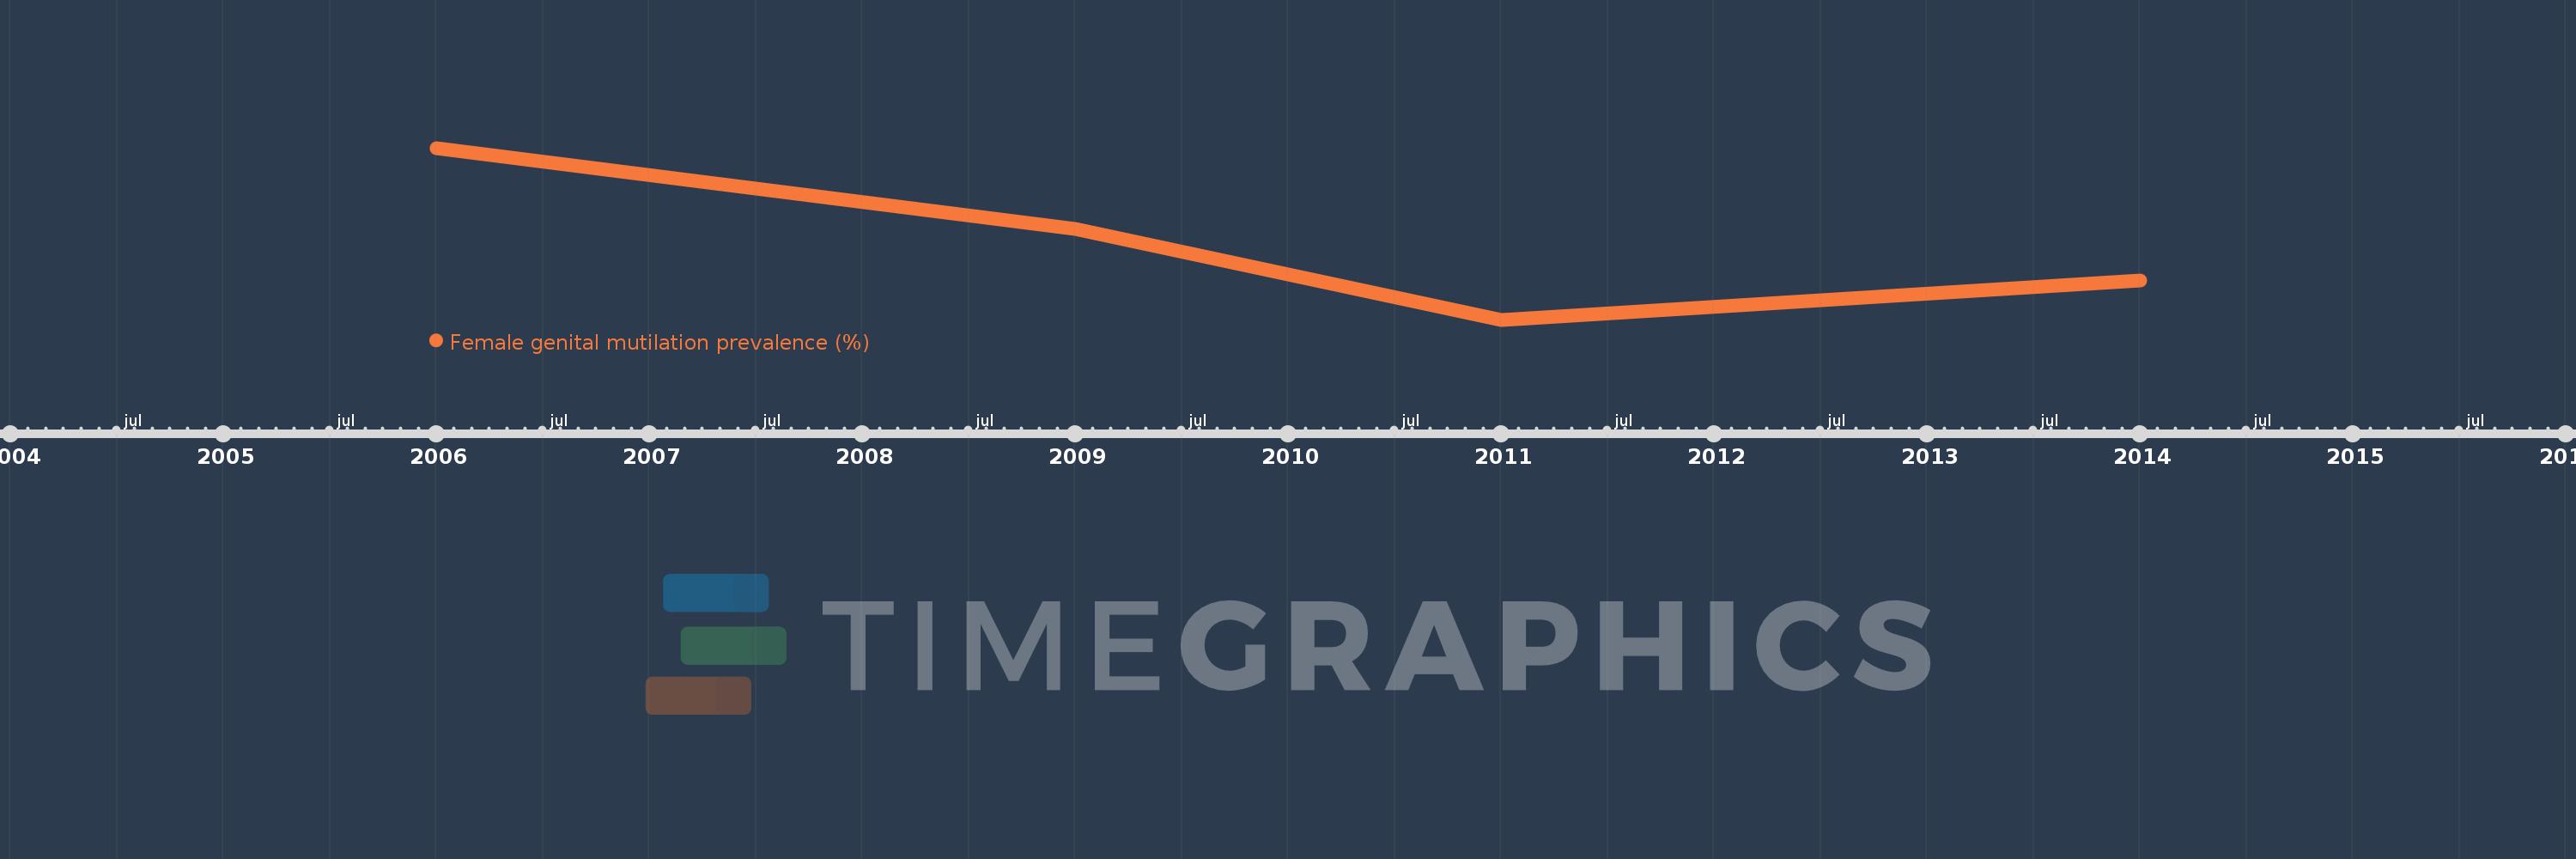
This timeline shows a graph from 2006 to 2014 of Sierra Leone. No data until 2005. Number of actual observations by date: 4.
Source name:
World Development Indicators
Source organization:
UNICEF Childinfo (childinfo.org).
Categories, topics:
Health
Last updated:
apr 23, 2017
Indicators value changes by year
At the date of observation
Value
Absolute change
Change from the previous value
jan 1, 2006
94.0
+94.0
0.0%
jan 1, 2009
91.3
-2.7
-2.87%
jan 1, 2011
88.3
-3.0
-3.29%
jan 1, 2014
89.6
+1.3
1.47%
Ranking of countries by current statistics by years
