This statistics in other country:
Timeline:
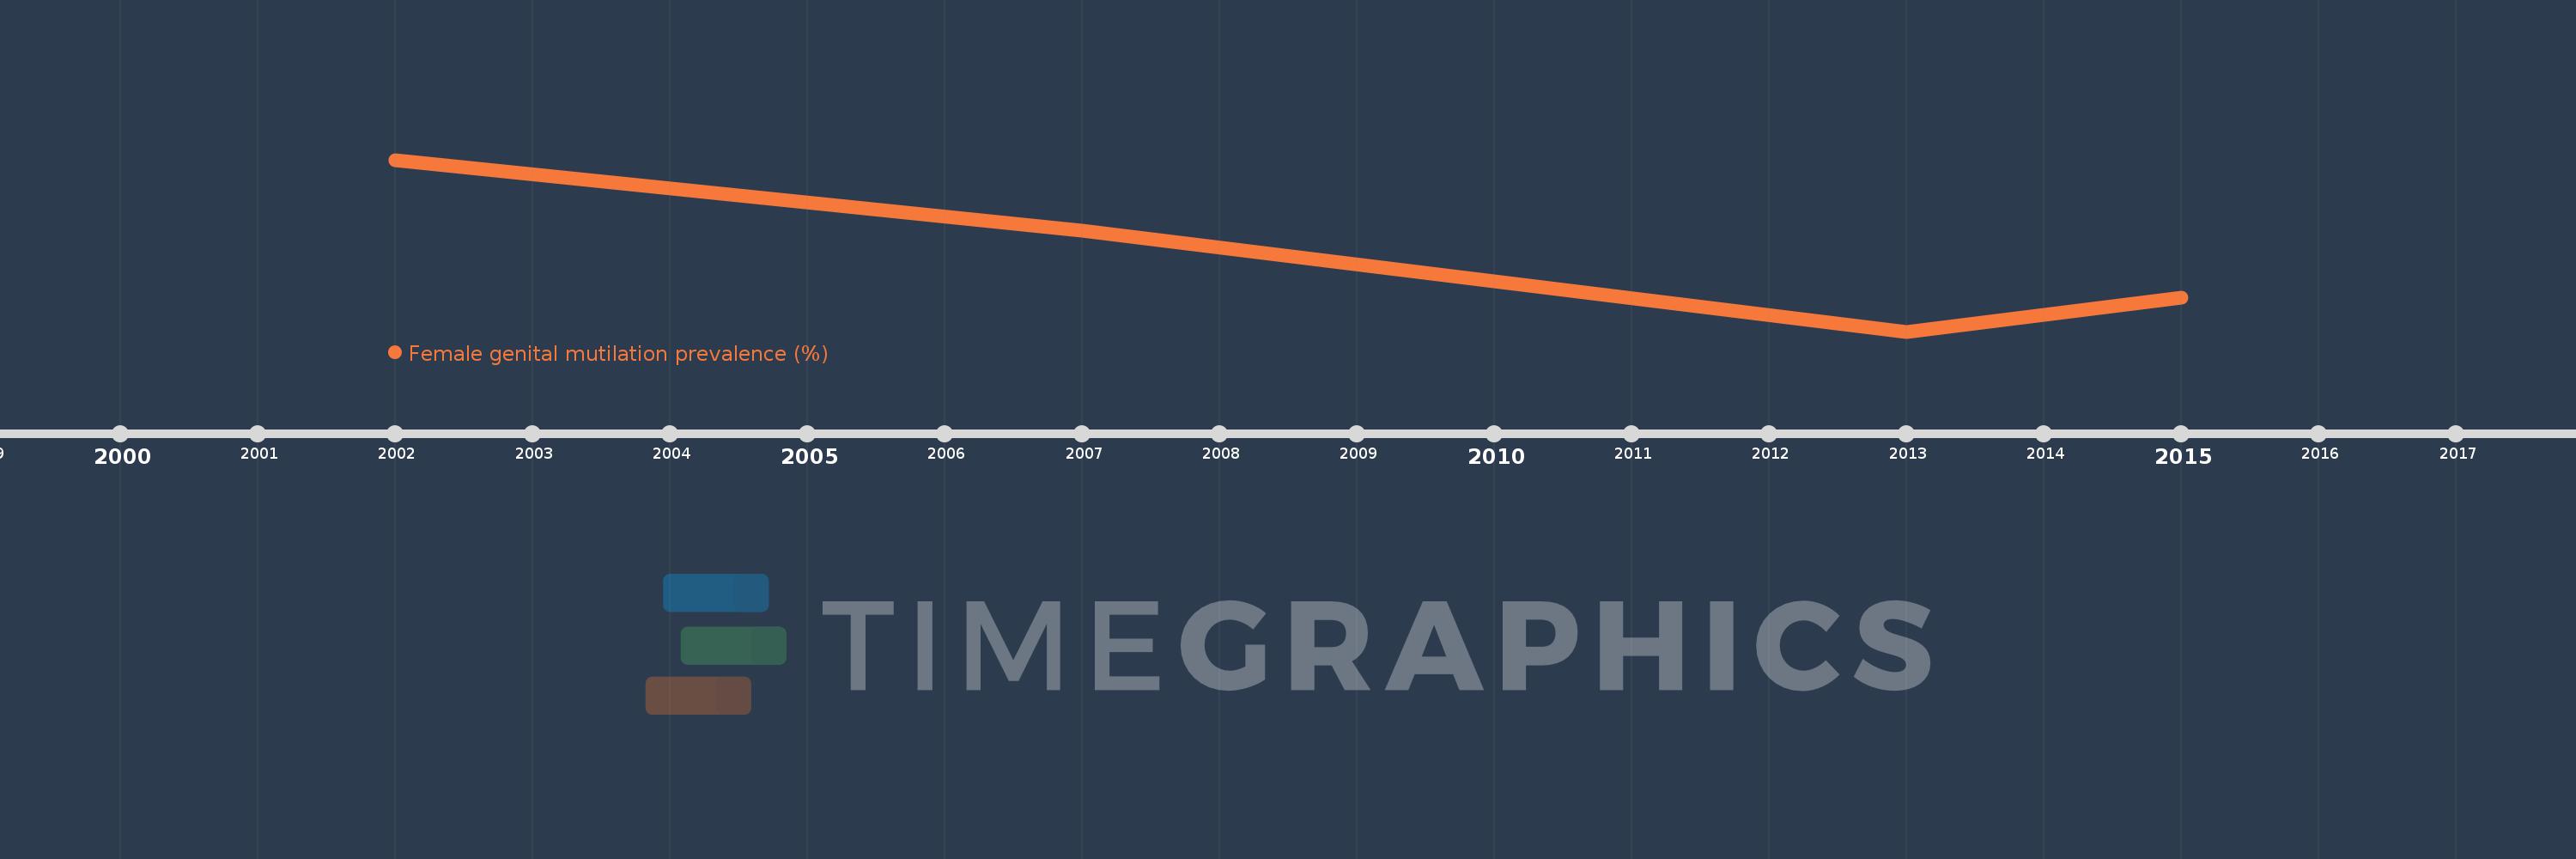
This timeline shows a graph from 2002 to 2015 of Benin. No data until 2001. Number of actual observations by date: 4.
Source name:
World Development Indicators
Source organization:
UNICEF Childinfo (childinfo.org).
Categories, topics:
Health
Last updated:
apr 23, 2017
Indicators value changes by year
At the date of observation
Value
Absolute change
Change from previous value
jan 1, 2002
16.8
+16.8
0.0%
jan 1, 2007
12.9
-3.9
-23.21%
jan 1, 2013
7.3
-5.6
-43.41%
jan 1, 2015
9.2
+1.9
26.03%
Ranking of countries by current statistics by years


Comments: