29
/
en
AIzaSyAYiBZKx7MnpbEhh9jyipgxe19OcubqV5w
April 1, 2024
237643
Serbia
SRB
true
2
1
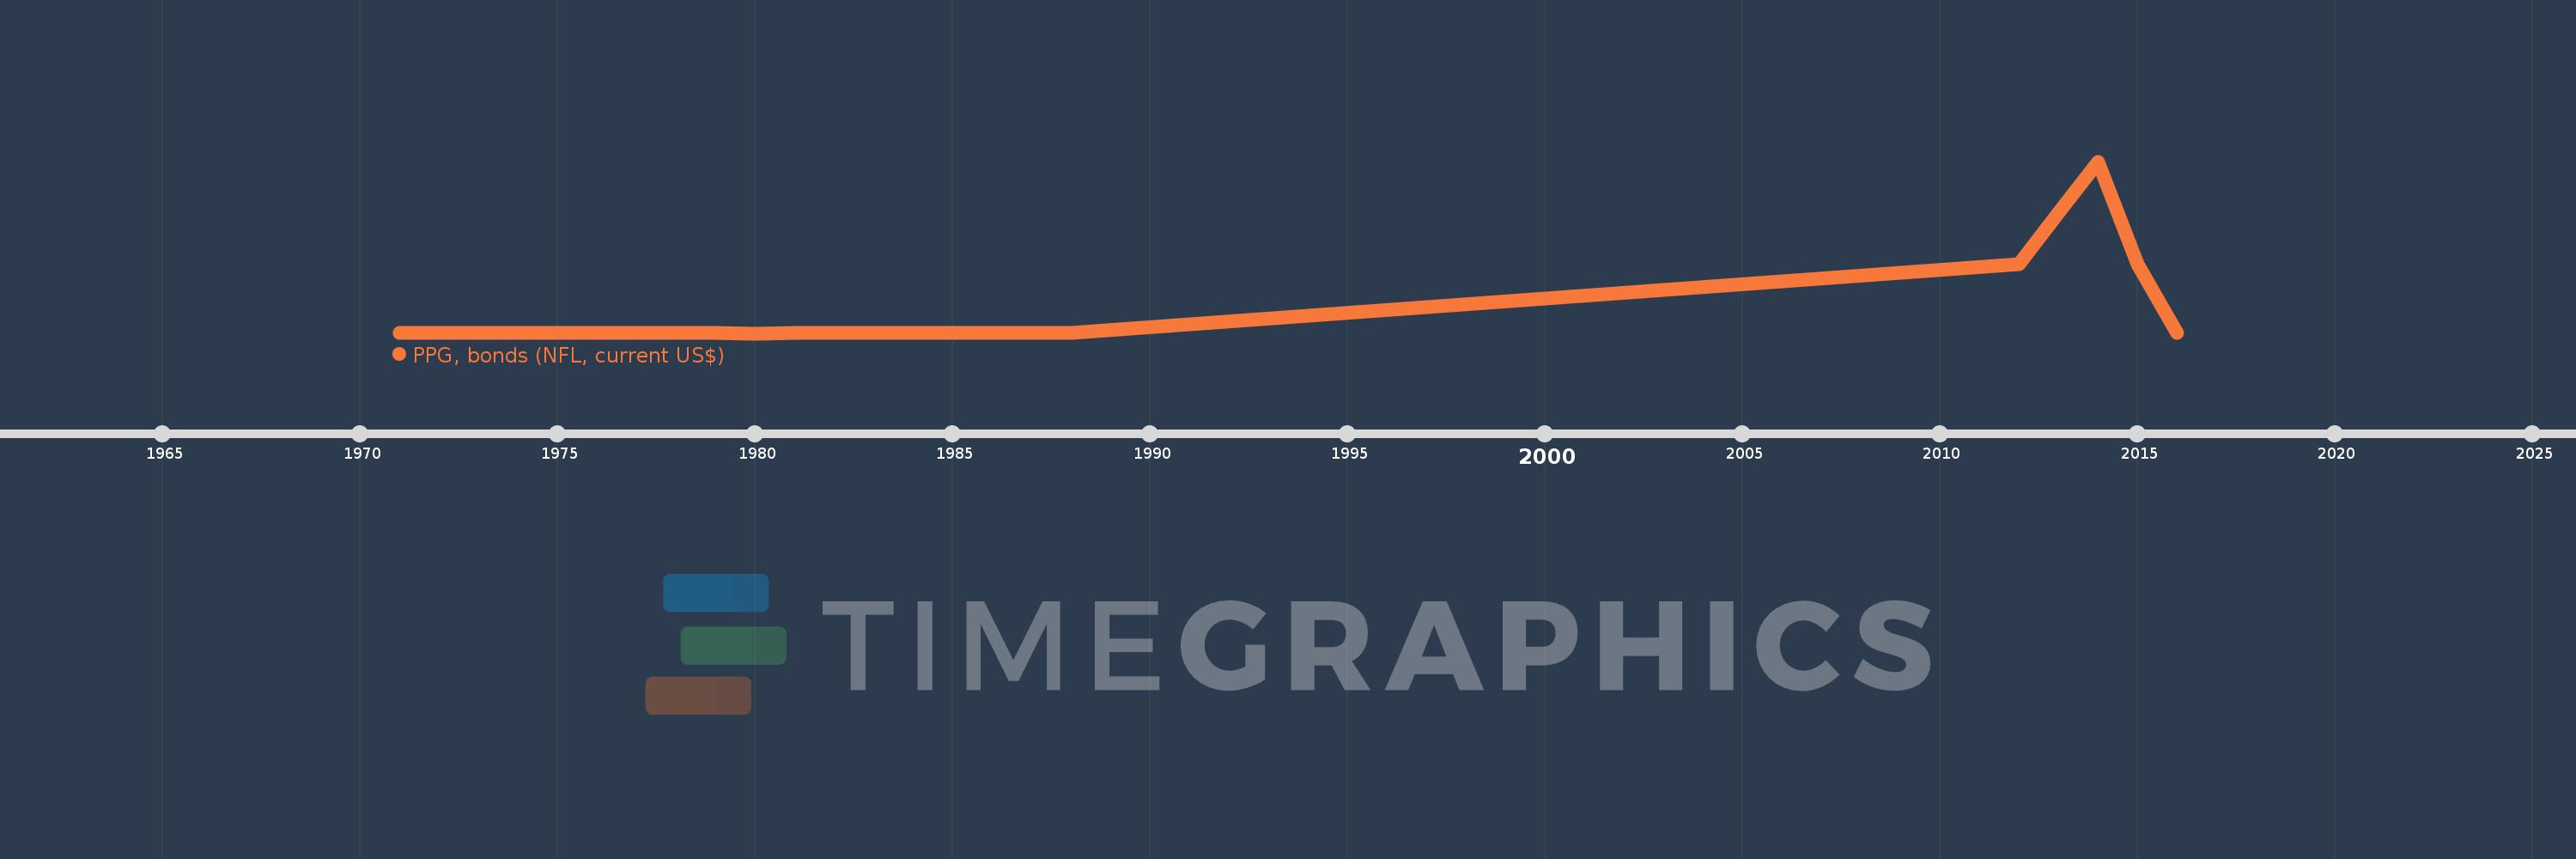
PPG, bonds (NFL, current US$)
2016,2015,2014,2013,2012,1988,1987,1986,1985,1984,1983,1982,1981,1980,1979,1978,1977,1976,1975,1974,1973,1972,1971
This statistics in other country:
Timeline:
This timeline shows a graph from 1971 to 2016 of Serbia. No data until 1970. Number of actual observations by date: 23.
Source name:
World Development Indicators
Source organization:
World Bank, International Debt Statistics.
Categories, topics:
External Debt
Last updated:
apr 23, 2017
Indicators value changes by year
Minimum:
-2.31 mln
jan 1, 1980
Maximum:
2.5 bln
jan 1, 2014
At the date of observation
Value
Absolute change
Change from previous value
jan 1, 1971
-1.779 mln
-1.779 mln
0.0%
jan 1, 1972
-860.0K
+919.0K
-51.66%
jan 1, 1973
-686.0K
+174.0K
-20.23%
jan 1, 1974
-676.0K
+10.0K
-1.46%
jan 1, 1975
-763.0K
-87.0K
12.87%
jan 1, 1976
-770.0K
-7.0K
0.92%
jan 1, 1977
-762.0K
+8.0K
-1.04%
jan 1, 1978
-2.04 mln
-1.278 mln
167.72%
jan 1, 1979
-2.25 mln
-210.0K
10.29%
jan 1, 1980
-2.31 mln
-60.0K
2.67%
jan 1, 1981
-2.113 mln
+197.0K
-8.53%
jan 1, 1982
-1.76 mln
+353.0K
-16.71%
jan 1, 1983
-1.402 mln
+358.0K
-20.34%
jan 1, 1984
-1.402 mln
0.0
0.0%
jan 1, 1985
-1.402 mln
0.0
0.0%
jan 1, 1986
-1.402 mln
0.0
0.0%
jan 1, 1987
-1.402 mln
0.0
0.0%
jan 1, 1988
-866.0K
+536.0K
-38.23%
jan 1, 2012
1000.0 mln
+1.001 bln
-115.57K%
jan 1, 2013
1.75 bln
+750.0 mln
75.0%
jan 1, 2014
2.5 bln
+750.0 mln
42.86%
jan 1, 2015
1000.0 mln
-1.5 bln
-60.0%
jan 1, 2016
0.0
-1000.0 mln
-100.0%
Ranking of countries by current statistics by years


Comments: