29
/
en
AIzaSyAYiBZKx7MnpbEhh9jyipgxe19OcubqV5w
April 1, 2024
94081
Bulgaria
BGR
true
2
1
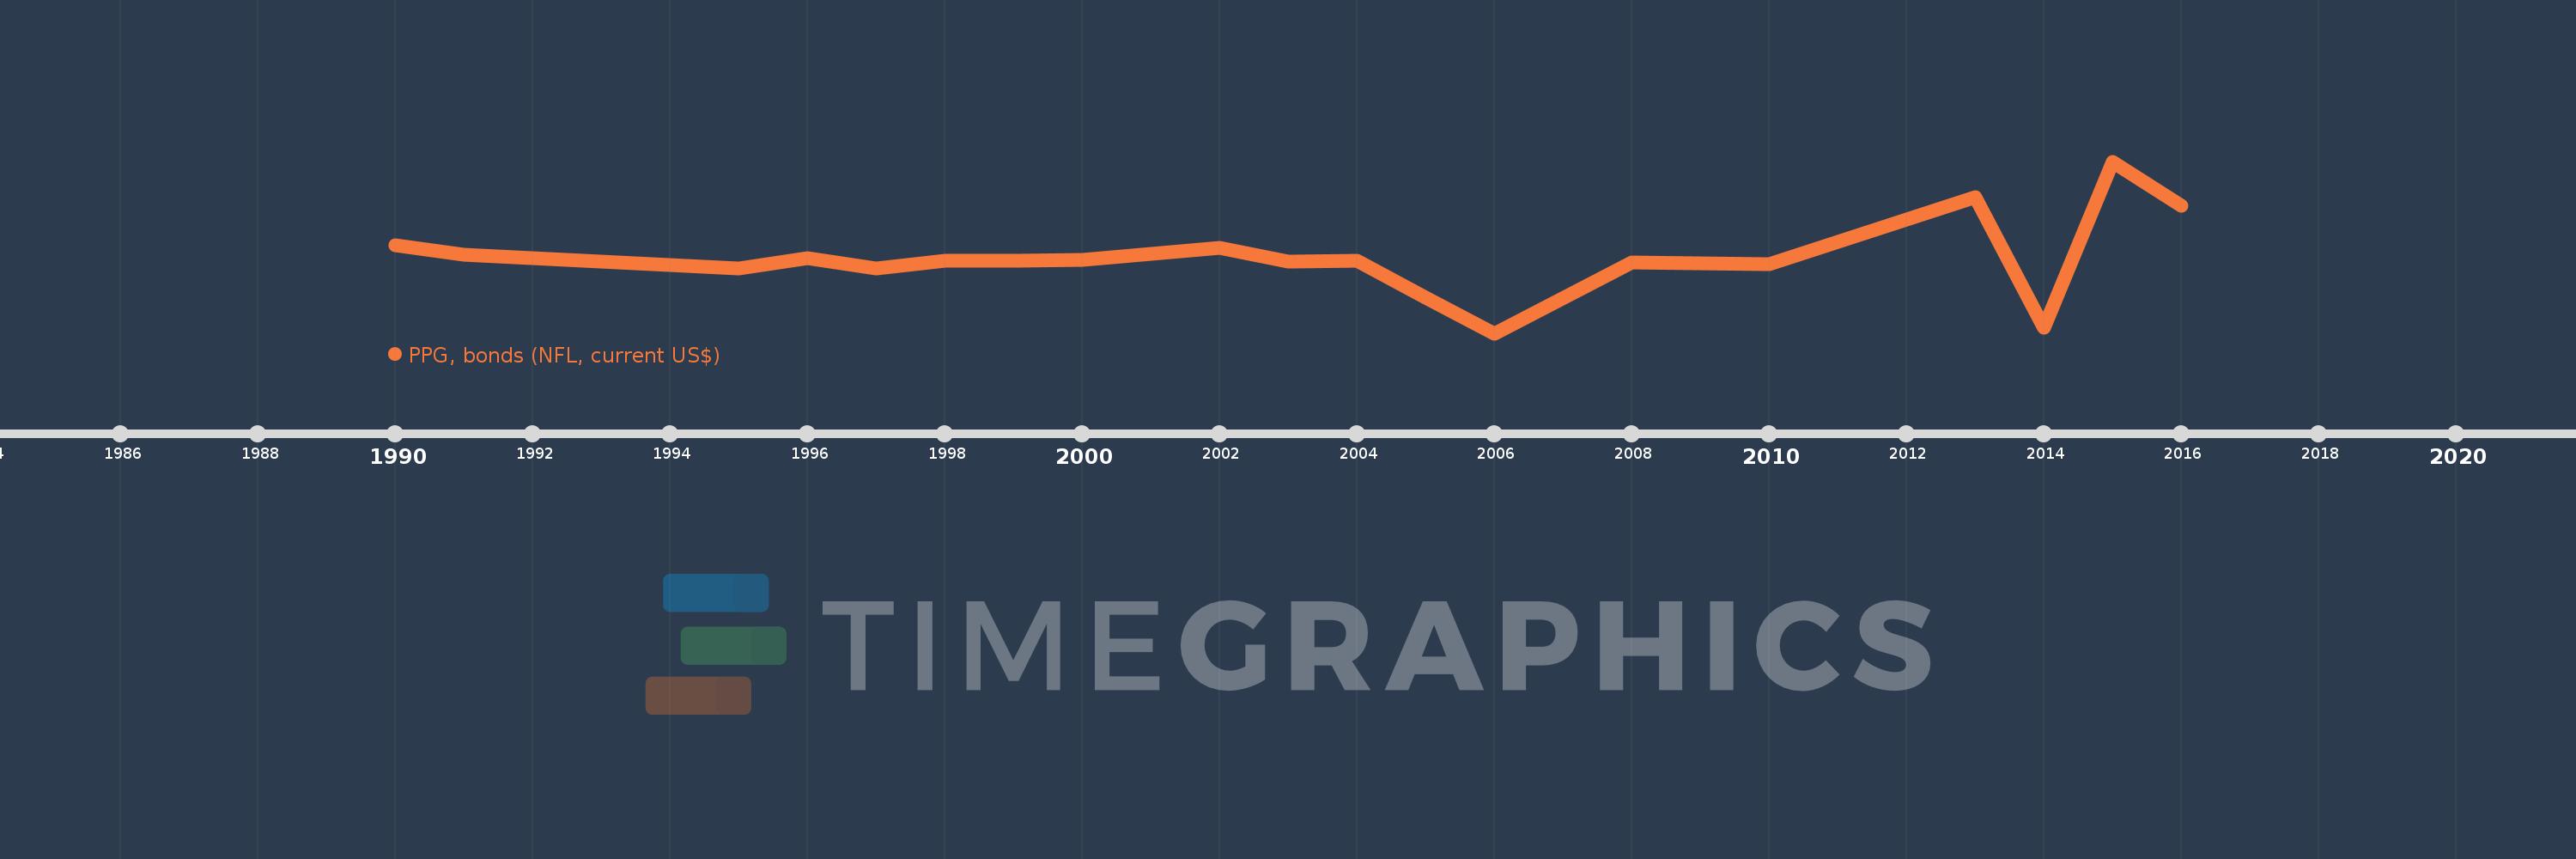
PPG, bonds (NFL, current US$)
2016,2015,2014,2013,2010,2008,2006,2005,2004,2003,2002,2000,1999,1998,1997,1996,1995,1991,1990
This statistics in other country:
Timeline:
This timeline shows a graph from 1990 to 2016 of Bulgaria. No data until 1989. Number of actual observations by date: 19.
Source name:
World Development Indicators
Source organization:
World Bank, International Debt Statistics.
Categories, topics:
External Debt
Last updated:
apr 23, 2017
Indicators value changes by year
Minimum:
-1.496 bln
jan 1, 2006
Maximum:
1.904 bln
jan 1, 2015
At the date of observation
Value
Absolute change
Change from previous value
jan 1, 1990
240.041 mln
+240.041 mln
0.0%
jan 1, 1991
64.529 mln
-175.512 mln
-73.12%
jan 1, 1995
-207.392 mln
-271.921 mln
-421.39%
jan 1, 1996
-5.549 mln
+201.843 mln
-97.32%
jan 1, 1997
-205.017 mln
-199.468 mln
3.59K%
jan 1, 1998
-61.494 mln
+143.523 mln
-70.01%
jan 1, 1999
-55.892 mln
+5.602 mln
-9.11%
jan 1, 2000
-35.104 mln
+20.788 mln
-37.19%
jan 1, 2002
201.476 mln
+236.58 mln
-673.94%
jan 1, 2003
-79.184 mln
-280.66 mln
-139.3%
jan 1, 2004
-66.662 mln
+12.522 mln
-15.81%
jan 1, 2005
-787.184 mln
-720.522 mln
1.08K%
jan 1, 2006
-1.496 bln
-708.793 mln
90.04%
jan 1, 2008
-86.849 mln
+1.409 bln
-94.19%
jan 1, 2010
-122.888 mln
-36.039 mln
41.5%
jan 1, 2013
1.201 bln
+1.324 bln
-1.08K%
jan 1, 2014
-1.38 bln
-2.581 bln
-214.95%
jan 1, 2015
1.904 bln
+3.284 bln
-237.95%
jan 1, 2016
1.025 bln
-879.141 mln
-46.17%
Ranking of countries by current statistics by years


Comments: