29
/
en
AIzaSyAYiBZKx7MnpbEhh9jyipgxe19OcubqV5w
April 1, 2024
233597
Sao Tome and Principe
STP
true
2
1
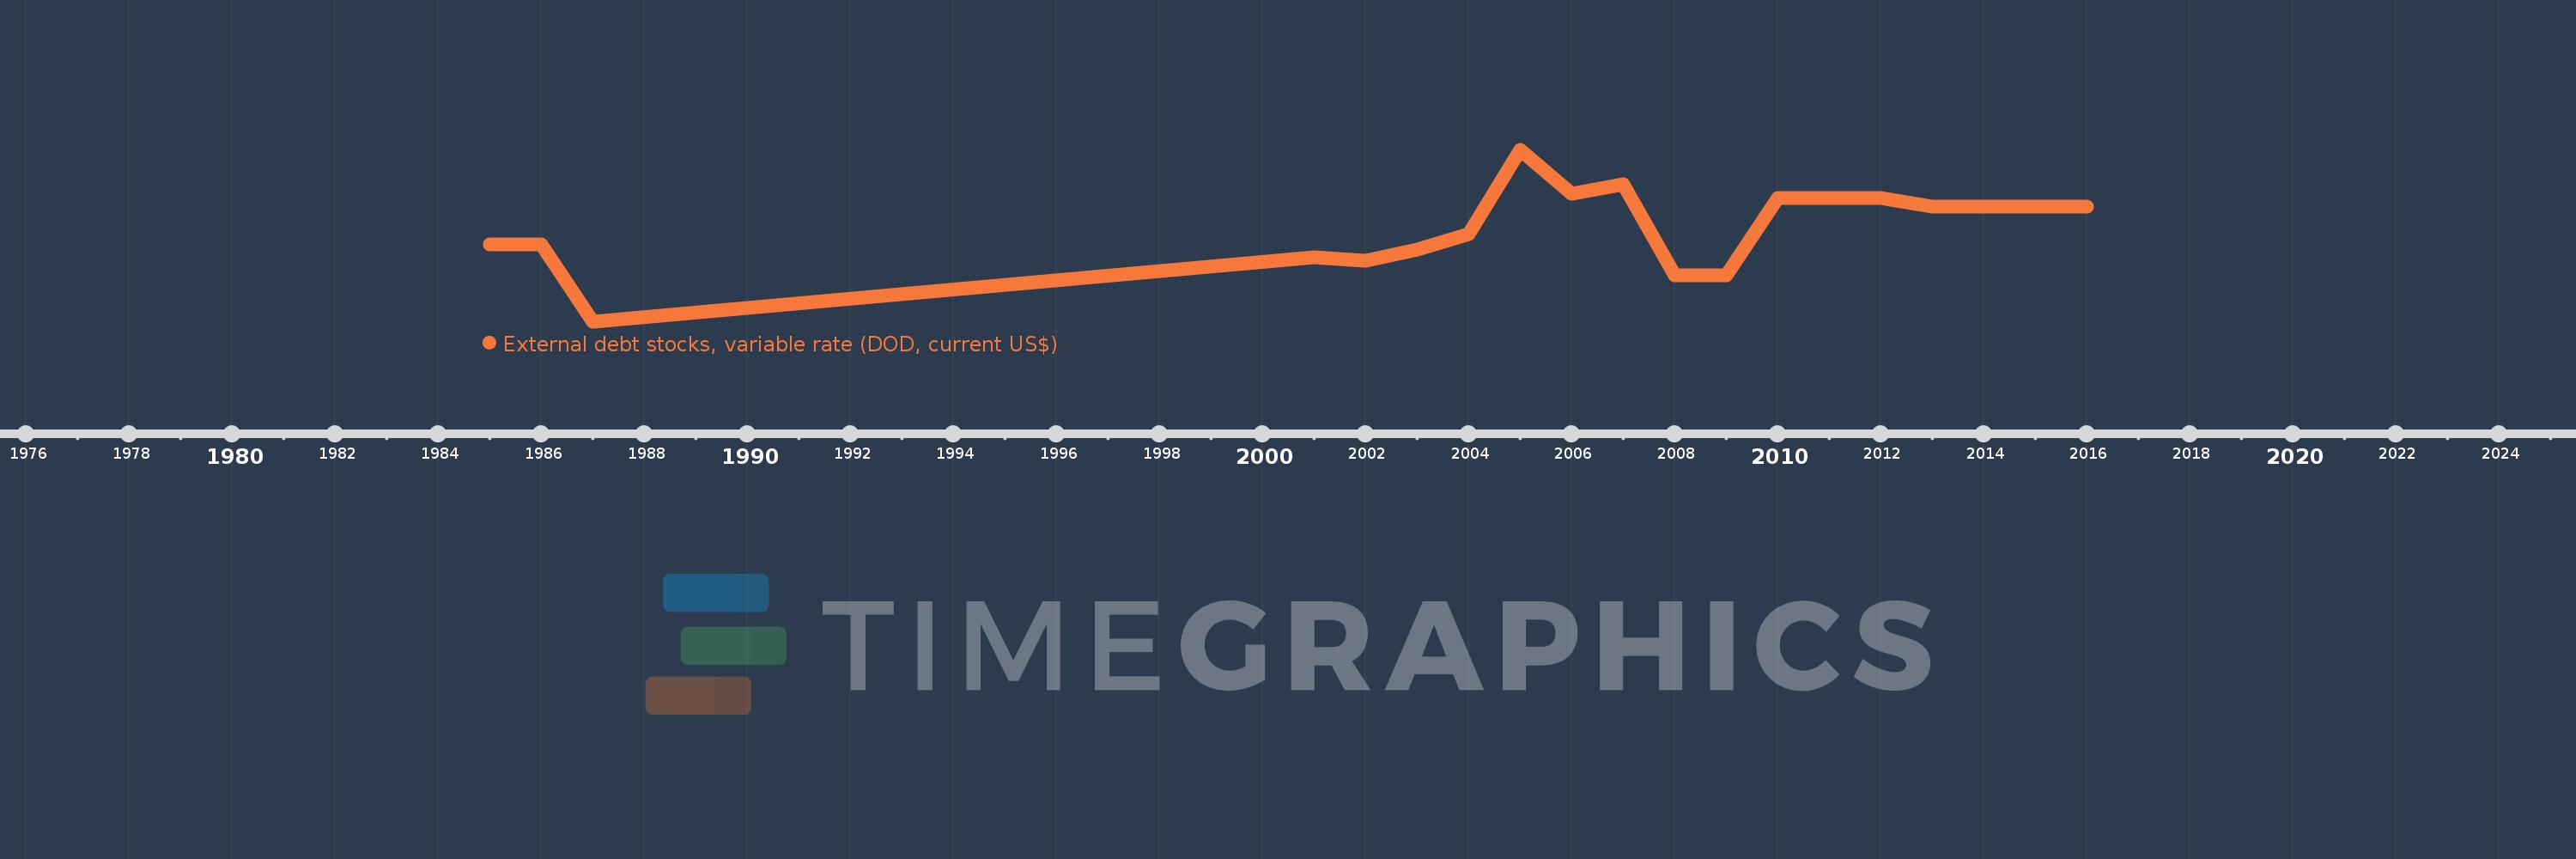
External debt stocks, variable rate (DOD, current US$)
2016,2015,2014,2013,2012,2011,2010,2009,2008,2007,2006,2005,2004,2003,2002,2001,1987,1986,1985
This statistics in other country:
Timeline:
This timeline shows a graph from 1985 to 2016 of Sao Tome and Principe. No data until 1984. Number of actual observations by date: 19.
Source name:
World Development Indicators
Source organization:
World Bank, International Debt Statistics.
Categories, topics:
External Debt
Last updated:
apr 23, 2017
Indicators value changes by year
Maximum:
11.116 mln
jan 1, 2005
At the date of observation
Value
Absolute change
Change from previous value
jan 1, 1985
5.0 mln
+5.0 mln
0.0%
jan 1, 1986
5.0 mln
0.0
0.0%
jan 1, 1987
0.0
-5.0 mln
-100.0%
jan 1, 2001
4.178 mln
+4.178 mln
%
jan 1, 2002
3.957 mln
-221.0K
-5.29%
jan 1, 2003
4.709 mln
+752.0K
19.0%
jan 1, 2004
5.671 mln
+962.0K
20.43%
jan 1, 2005
11.116 mln
+5.445 mln
96.01%
jan 1, 2006
8.297 mln
-2.819 mln
-25.36%
jan 1, 2007
8.913 mln
+616.0K
7.42%
jan 1, 2008
3.0 mln
-5.913 mln
-66.34%
jan 1, 2009
3.0 mln
0.0
0.0%
jan 1, 2010
8.0 mln
+5.0 mln
166.67%
jan 1, 2011
8.0 mln
0.0
0.0%
jan 1, 2012
8.0 mln
0.0
0.0%
jan 1, 2013
7.464 mln
-536.0K
-6.7%
jan 1, 2014
7.464 mln
0.0
0.0%
jan 1, 2015
7.464 mln
0.0
0.0%
jan 1, 2016
7.464 mln
0.0
0.0%
Ranking of countries by current statistics by years


Comments: