29
/
en
AIzaSyAYiBZKx7MnpbEhh9jyipgxe19OcubqV5w
April 1, 2024
80483
Belarus
BLR
true
2
1
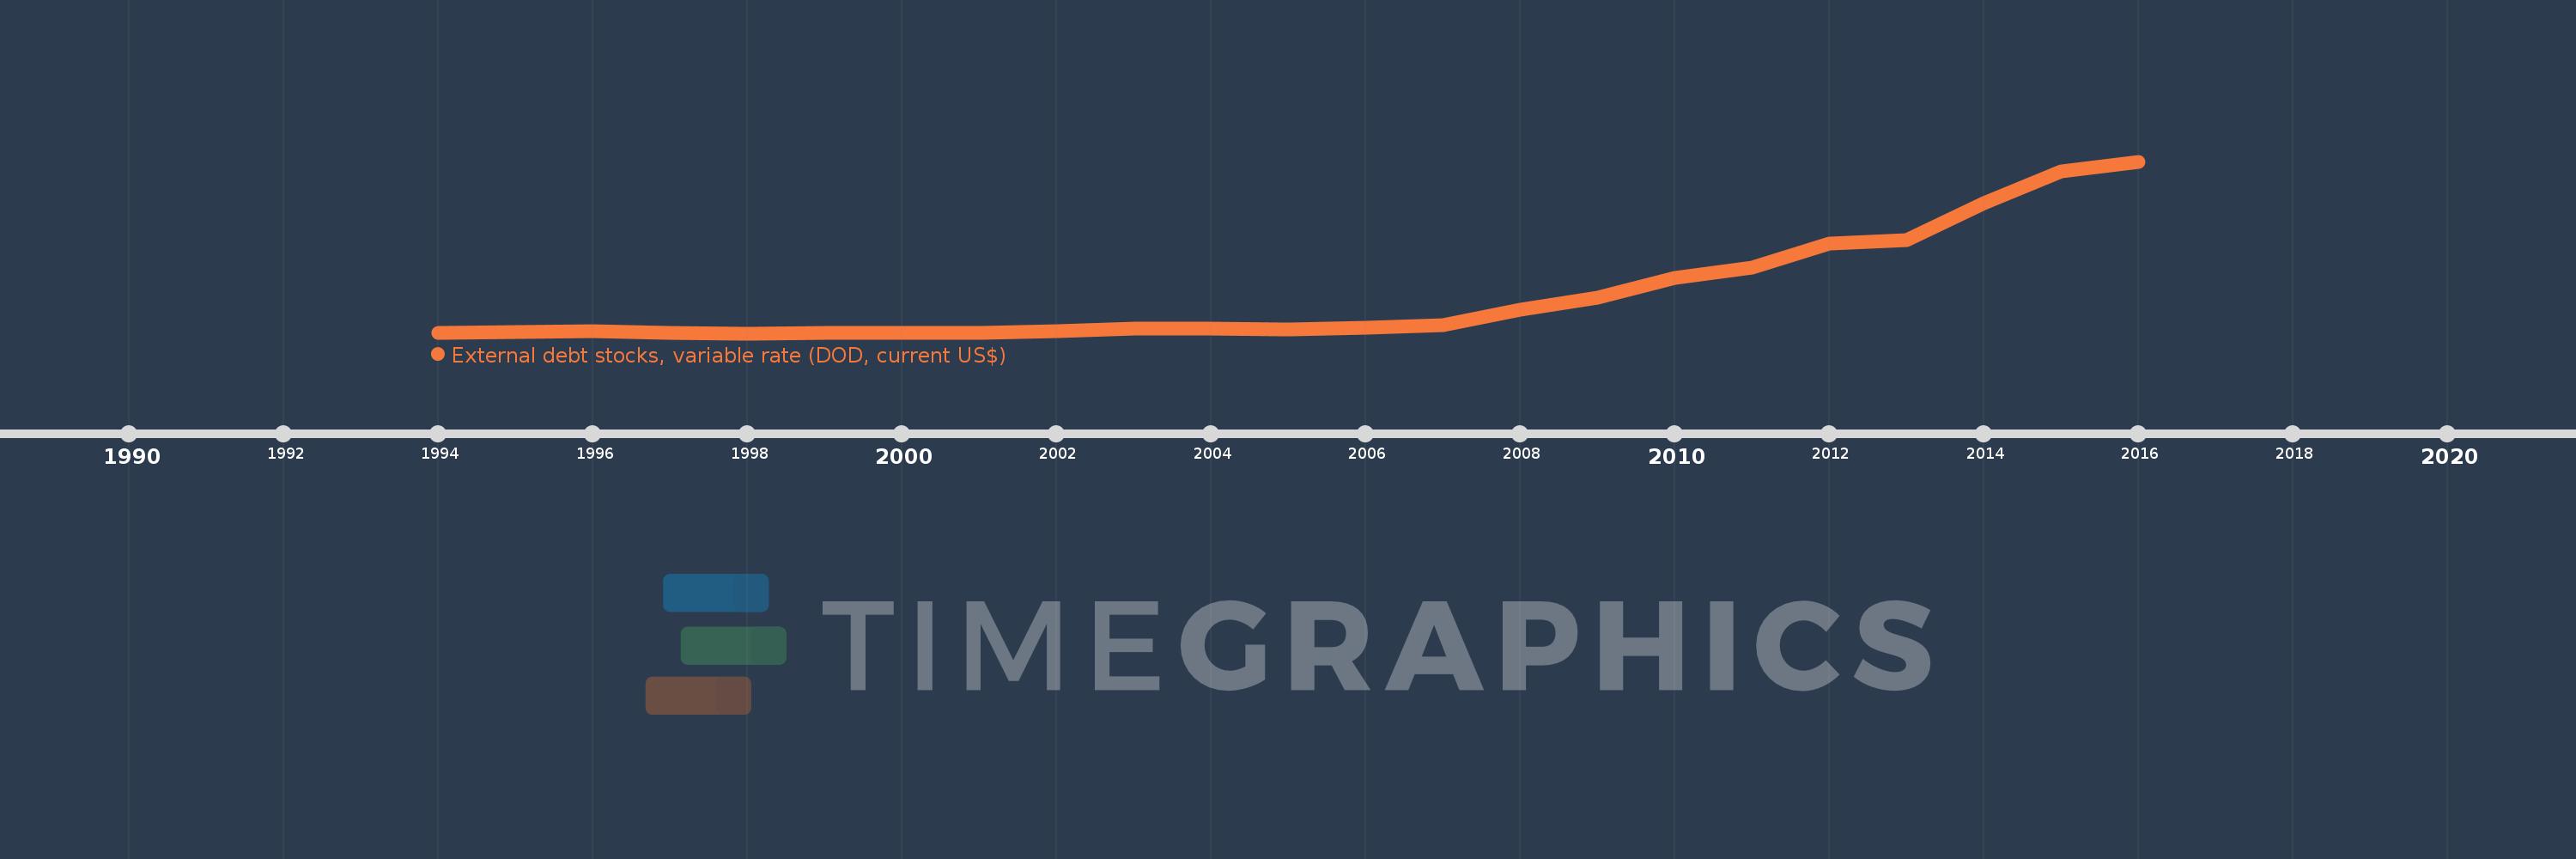
External debt stocks, variable rate (DOD, current US$)
2016,2015,2014,2013,2012,2011,2010,2009,2008,2007,2006,2005,2004,2003,2002,2001,2000,1999,1998,1997,1996,1995,1994
This statistics in other country:
Timeline:
This timeline shows a graph from 1994 to 2016 of Belarus. No data until 1993. Number of actual observations by date: 23.
Source name:
World Development Indicators
Source organization:
World Bank, International Debt Statistics.
Categories, topics:
External Debt
Last updated:
apr 23, 2017
Indicators value changes by year
Minimum:
449.918 mln
jan 1, 1998
Maximum:
19.976 bln
jan 1, 2016
At the date of observation
Value
Absolute change
Change from previous value
jan 1, 1994
451.288 mln
+451.288 mln
0.0%
jan 1, 1995
591.428 mln
+140.14 mln
31.05%
jan 1, 1996
696.091 mln
+104.663 mln
17.7%
jan 1, 1997
502.407 mln
-193.684 mln
-27.82%
jan 1, 1998
449.918 mln
-52.489 mln
-10.45%
jan 1, 1999
528.537 mln
+78.619 mln
17.47%
jan 1, 2000
449.925 mln
-78.612 mln
-14.87%
jan 1, 2001
504.999 mln
+55.074 mln
12.24%
jan 1, 2002
684.231 mln
+179.232 mln
35.49%
jan 1, 2003
973.289 mln
+289.058 mln
42.25%
jan 1, 2004
1.013 bln
+39.506 mln
4.06%
jan 1, 2005
896.961 mln
-115.834 mln
-11.44%
jan 1, 2006
1.096 bln
+199.445 mln
22.24%
jan 1, 2007
1.408 bln
+311.951 mln
28.45%
jan 1, 2008
3.165 bln
+1.756 bln
124.7%
jan 1, 2009
4.472 bln
+1.308 bln
41.32%
jan 1, 2010
6.794 bln
+2.321 bln
51.91%
jan 1, 2011
7.963 bln
+1.169 bln
17.21%
jan 1, 2012
10.606 bln
+2.644 bln
33.2%
jan 1, 2013
11.036 bln
+429.744 mln
4.05%
jan 1, 2014
15.248 bln
+4.212 bln
38.16%
jan 1, 2015
18.832 bln
+3.584 bln
23.51%
jan 1, 2016
19.976 bln
+1.144 bln
6.07%
Ranking of countries by current statistics by years


Comments: