29
/
en
AIzaSyAYiBZKx7MnpbEhh9jyipgxe19OcubqV5w
April 1, 2024
227043
Puerto Rico
PRI
true
2
1
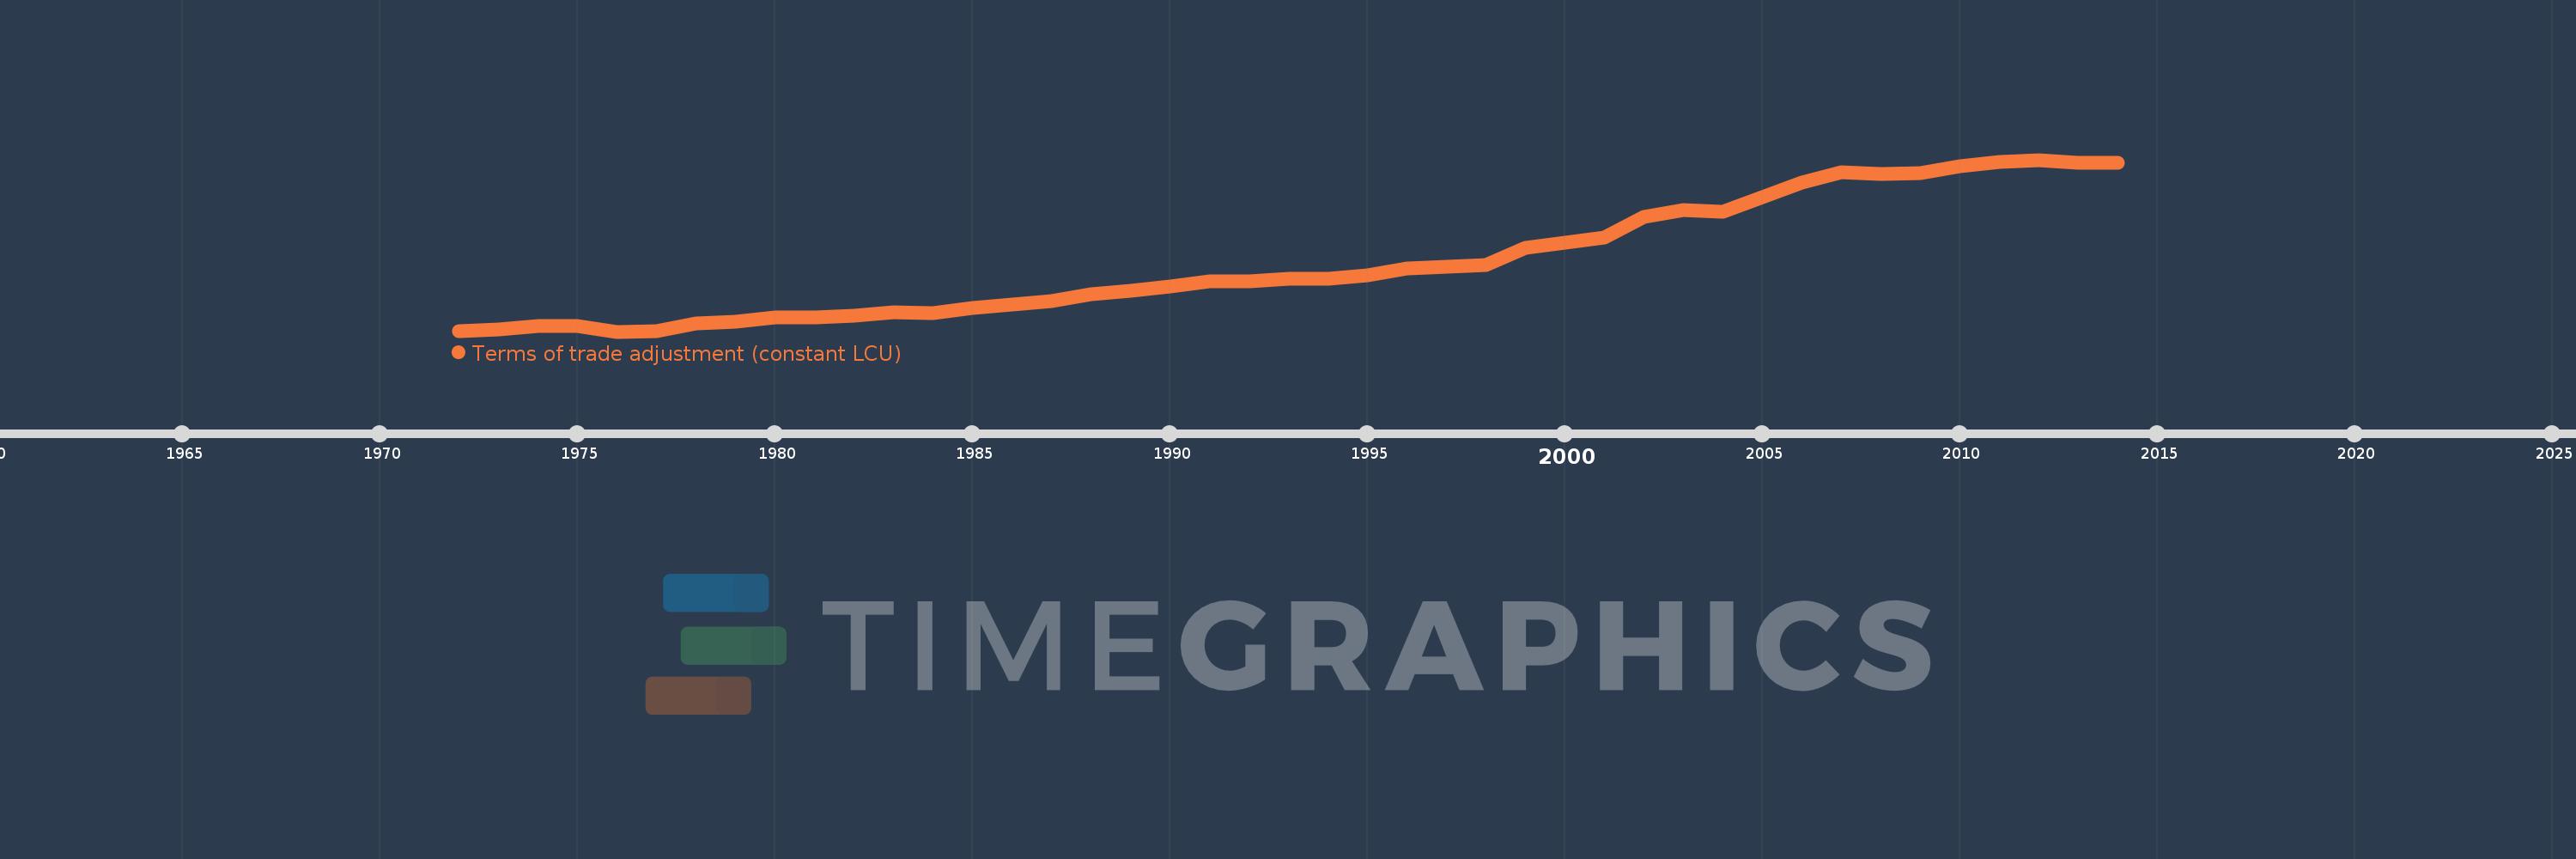
Terms of trade adjustment (constant LCU)
2014,2013,2012,2011,2010,2009,2008,2007,2006,2005,2004,2003,2002,2001,2000,1999,1998,1997,1996,1995,1994,1993,1992,1991,1990,1989,1988,1987,1986,1985,1984,1983,1982,1981,1980,1979,1978,1977,1976,1975,1974,1973,1972
This statistics in other country:
AlbaniaAlgeriaAngolaAntigua and BarbudaArgentinaArmeniaAustraliaAustriaAzerbaijanBahamas, TheBahrainBangladeshBarbadosBelarusBelgiumBelizeBeninBhutanBoliviaBosnia and HerzegovinaBotswanaBrazilBrunei DarussalamBulgariaBurkina FasoBurundiCabo VerdeCambodiaCameroonCanadaChadChileColombiaComorosCongo, Dem. Rep.Congo, Rep.Costa RicaCote d'IvoireCroatiaCubaCyprusCzech RepublicDenmarkDjiboutiDominican RepublicEcuadorEgypt, Arab Rep.El SalvadorEquatorial GuineaEritreaEstoniaEthiopiaFijiFinlandFranceGabonGambia, TheGeorgiaGermanyGhanaGreeceGuatemalaGuineaGuinea-BissauHaitiHondurasHong Kong SAR, ChinaHungaryIcelandIndiaIndonesiaIran, Islamic Rep.IrelandIsraelItalyJamaicaJapanJordanKazakhstanKenyaKorea, Rep.KosovoKuwaitKyrgyz RepublicLao PDRLatviaLebanonLiberiaLibyaLithuaniaLuxembourgMacao SAR, ChinaMacedonia, FYRMadagascarMalawiMalaysiaMaliMaltaMauritaniaMauritiusMexicoMoldovaMongoliaMontenegroMoroccoMozambiqueMyanmarNamibiaNepalNetherlandsNew ZealandNicaraguaNigerNigeriaNorwayOmanPakistanPanamaPapua New GuineaParaguayPeruPhilippinesPolandPortugalPuerto RicoQatarRomaniaRussian FederationRwandaSamoaSaudi ArabiaSenegalSerbiaSeychellesSierra LeoneSingaporeSlovak RepublicSloveniaSomaliaSouth AfricaSouth SudanSpainSri LankaSudanSurinameSwazilandSwedenSwitzerlandSyrian Arab RepublicTajikistanTanzaniaThailandTimor-LesteTogoTrinidad and TobagoTunisiaTurkeyTurkmenistanUgandaUkraineUnited Arab EmiratesUnited KingdomUnited StatesUruguayUzbekistanVanuatuVenezuela, RBVietnamWest Bank and GazaZambiaZimbabwe Timeline:
This timeline shows a graph from 1972 to 2014 of Puerto Rico. No data until 1971. Number of actual observations by date: 43.
Source name:
World Development Indicators
Source organization:
World Bank national accounts data, and OECD National Accounts data files.
Categories, topics:
Economy & Growth
Last updated:
apr 23, 2017
Indicators value changes by year
Minimum:
1.134 bln
jan 1, 1976
Maximum:
11.338 bln
jan 1, 2012
At the date of observation
Value
Absolute change
Change from previous value
jan 1, 1972
1.183 bln
+1.183 bln
0.0%
jan 1, 1973
1.241 bln
+58.104 mln
4.91%
jan 1, 1974
1.468 bln
+227.038 mln
18.29%
jan 1, 1975
1.478 bln
+10.136 mln
0.69%
jan 1, 1976
1.134 bln
-344.675 mln
-23.32%
jan 1, 1977
1.165 bln
+31.797 mln
2.81%
jan 1, 1978
1.602 bln
+436.494 mln
37.46%
jan 1, 1979
1.697 bln
+94.931 mln
5.93%
jan 1, 1980
1.959 bln
+261.803 mln
15.43%
jan 1, 1981
1.99 bln
+31.04 mln
1.58%
jan 1, 1982
2.07 bln
+80.237 mln
4.03%
jan 1, 1983
2.295 bln
+224.835 mln
10.86%
jan 1, 1984
2.247 bln
-48.013 mln
-2.09%
jan 1, 1985
2.515 bln
+268.605 mln
11.96%
jan 1, 1986
2.763 bln
+248.005 mln
9.86%
jan 1, 1987
2.956 bln
+193.064 mln
6.99%
jan 1, 1988
3.353 bln
+396.627 mln
13.42%
jan 1, 1989
3.58 bln
+227.526 mln
6.79%
jan 1, 1990
3.788 bln
+207.651 mln
5.8%
jan 1, 1991
4.136 bln
+348.265 mln
9.19%
jan 1, 1992
4.109 bln
-26.898 mln
-0.65%
jan 1, 1993
4.254 bln
+144.684 mln
3.52%
jan 1, 1994
4.253 bln
-892.632K
-0.02%
jan 1, 1995
4.468 bln
+215.032 mln
5.06%
jan 1, 1996
4.859 bln
+390.577 mln
8.74%
jan 1, 1997
5.005 bln
+145.654 mln
3.0%
jan 1, 1998
5.098 bln
+93.057 mln
1.86%
jan 1, 1999
6.119 bln
+1.021 bln
20.04%
jan 1, 2000
6.399 bln
+280.088 mln
4.58%
jan 1, 2001
6.733 bln
+334.461 mln
5.23%
jan 1, 2002
7.931 bln
+1.197 bln
17.78%
jan 1, 2003
8.346 bln
+415.362 mln
5.24%
jan 1, 2004
8.263 bln
-83.333 mln
-1.0%
jan 1, 2005
9.118 bln
+854.586 mln
10.34%
jan 1, 2006
10.007 bln
+889.291 mln
9.75%
jan 1, 2007
10.594 bln
+586.679 mln
5.86%
jan 1, 2008
10.473 bln
-120.578 mln
-1.14%
jan 1, 2009
10.557 bln
+83.732 mln
0.8%
jan 1, 2010
10.951 bln
+394.125 mln
3.73%
jan 1, 2011
11.207 bln
+255.943 mln
2.34%
jan 1, 2012
11.338 bln
+130.873 mln
1.17%
jan 1, 2013
11.155 bln
-182.503 mln
-1.61%
jan 1, 2014
11.176 bln
+20.644 mln
0.19%
Ranking of countries by current statistics by years


Comments: