29
/
en
AIzaSyAYiBZKx7MnpbEhh9jyipgxe19OcubqV5w
April 1, 2024
283063
Vietnam
VNM
true
2
1
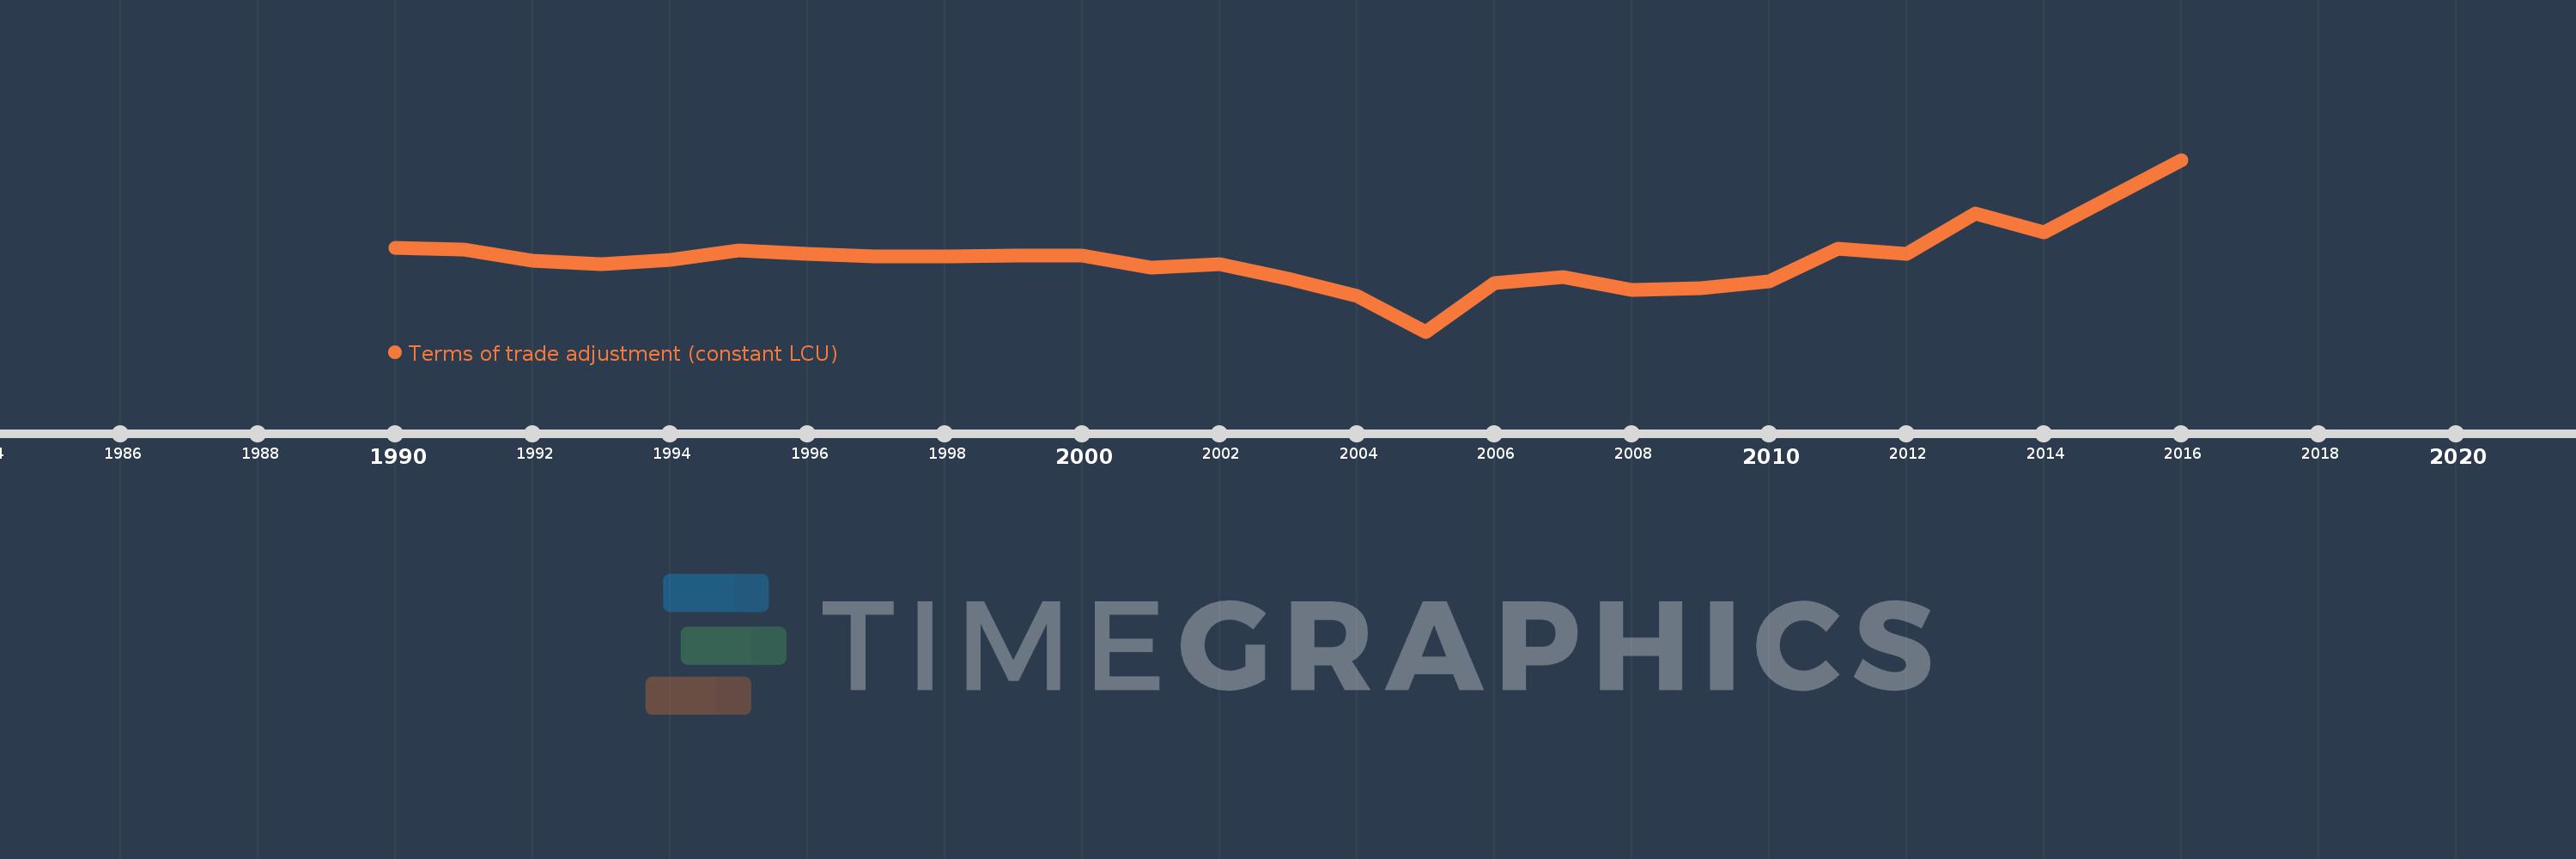
Terms of trade adjustment (constant LCU)
2016,2015,2014,2013,2012,2011,2010,2009,2008,2007,2006,2005,2004,2003,2002,2001,2000,1999,1998,1997,1996,1995,1994,1993,1992,1991,1990
This statistics in other country:
AlbaniaAlgeriaAngolaAntigua and BarbudaArgentinaArmeniaAustraliaAustriaAzerbaijanBahamas, TheBahrainBangladeshBarbadosBelarusBelgiumBelizeBeninBhutanBoliviaBosnia and HerzegovinaBotswanaBrazilBrunei DarussalamBulgariaBurkina FasoBurundiCabo VerdeCambodiaCameroonCanadaChadChileColombiaComorosCongo, Dem. Rep.Congo, Rep.Costa RicaCote d'IvoireCroatiaCubaCyprusCzech RepublicDenmarkDjiboutiDominican RepublicEcuadorEgypt, Arab Rep.El SalvadorEquatorial GuineaEritreaEstoniaEthiopiaFijiFinlandFranceGabonGambia, TheGeorgiaGermanyGhanaGreeceGuatemalaGuineaGuinea-BissauHaitiHondurasHong Kong SAR, ChinaHungaryIcelandIndiaIndonesiaIran, Islamic Rep.IrelandIsraelItalyJamaicaJapanJordanKazakhstanKenyaKorea, Rep.KosovoKuwaitKyrgyz RepublicLao PDRLatviaLebanonLiberiaLibyaLithuaniaLuxembourgMacao SAR, ChinaMacedonia, FYRMadagascarMalawiMalaysiaMaliMaltaMauritaniaMauritiusMexicoMoldovaMongoliaMontenegroMoroccoMozambiqueMyanmarNamibiaNepalNetherlandsNew ZealandNicaraguaNigerNigeriaNorwayOmanPakistanPanamaPapua New GuineaParaguayPeruPhilippinesPolandPortugalPuerto RicoQatarRomaniaRussian FederationRwandaSamoaSaudi ArabiaSenegalSerbiaSeychellesSierra LeoneSingaporeSlovak RepublicSloveniaSomaliaSouth AfricaSouth SudanSpainSri LankaSudanSurinameSwazilandSwedenSwitzerlandSyrian Arab RepublicTajikistanTanzaniaThailandTimor-LesteTogoTrinidad and TobagoTunisiaTurkeyTurkmenistanUgandaUkraineUnited Arab EmiratesUnited KingdomUnited StatesUruguayUzbekistanVanuatuVenezuela, RBVietnamWest Bank and GazaZambiaZimbabwe Timeline:
This timeline shows a graph from 1990 to 2016 of Vietnam. No data until 1989. Number of actual observations by date: 27.
Source name:
World Development Indicators
Source organization:
World Bank national accounts data, and OECD National Accounts data files.
Categories, topics:
Economy & Growth
Last updated:
apr 23, 2017
Indicators value changes by year
Minimum:
-151.522 trl
jan 1, 2005
Maximum:
163.02 trl
jan 1, 2016
At the date of observation
Value
Absolute change
Change from previous value
jan 1, 1990
1.753 trl
+1.753 trl
0.0%
jan 1, 1991
-956.349 bln
-2.71 trl
-154.54%
jan 1, 1992
-22.288 trl
-21.331 trl
2.23K%
jan 1, 1993
-28.362 trl
-6.075 trl
27.26%
jan 1, 1994
-19.748 trl
+8.614 trl
-30.37%
jan 1, 1995
-2.689 trl
+17.059 trl
-86.38%
jan 1, 1996
-8.696 trl
-6.007 trl
223.37%
jan 1, 1997
-13.989 trl
-5.293 trl
60.86%
jan 1, 1998
-14.133 trl
-144.266 bln
1.03%
jan 1, 1999
-11.8 trl
+2.333 trl
-16.51%
jan 1, 2000
-12.085 trl
-284.677 bln
2.41%
jan 1, 2001
-34.921 trl
-22.836 trl
188.97%
jan 1, 2002
-28.177 trl
+6.744 trl
-19.31%
jan 1, 2003
-55.076 trl
-26.898 trl
95.46%
jan 1, 2004
-85.541 trl
-30.465 trl
55.31%
jan 1, 2005
-151.522 trl
-65.982 trl
77.13%
jan 1, 2006
-63.201 trl
+88.322 trl
-58.29%
jan 1, 2007
-52.2 trl
+11.001 trl
-17.41%
jan 1, 2008
-75.922 trl
-23.722 trl
45.45%
jan 1, 2009
-71.785 trl
+4.137 trl
-5.45%
jan 1, 2010
-59.331 trl
+12.454 trl
-17.35%
jan 1, 2011
0.0
+59.331 trl
-100.0%
jan 1, 2012
-8.592 trl
-8.592 trl
%
jan 1, 2013
64.029 trl
+72.621 trl
-845.26%
jan 1, 2014
30.051 trl
-33.979 trl
-53.07%
jan 1, 2015
96.576 trl
+66.525 trl
221.37%
jan 1, 2016
163.02 trl
+66.445 trl
68.8%
Ranking of countries by current statistics by years


Comments: