This statistics in other country:
Timeline:
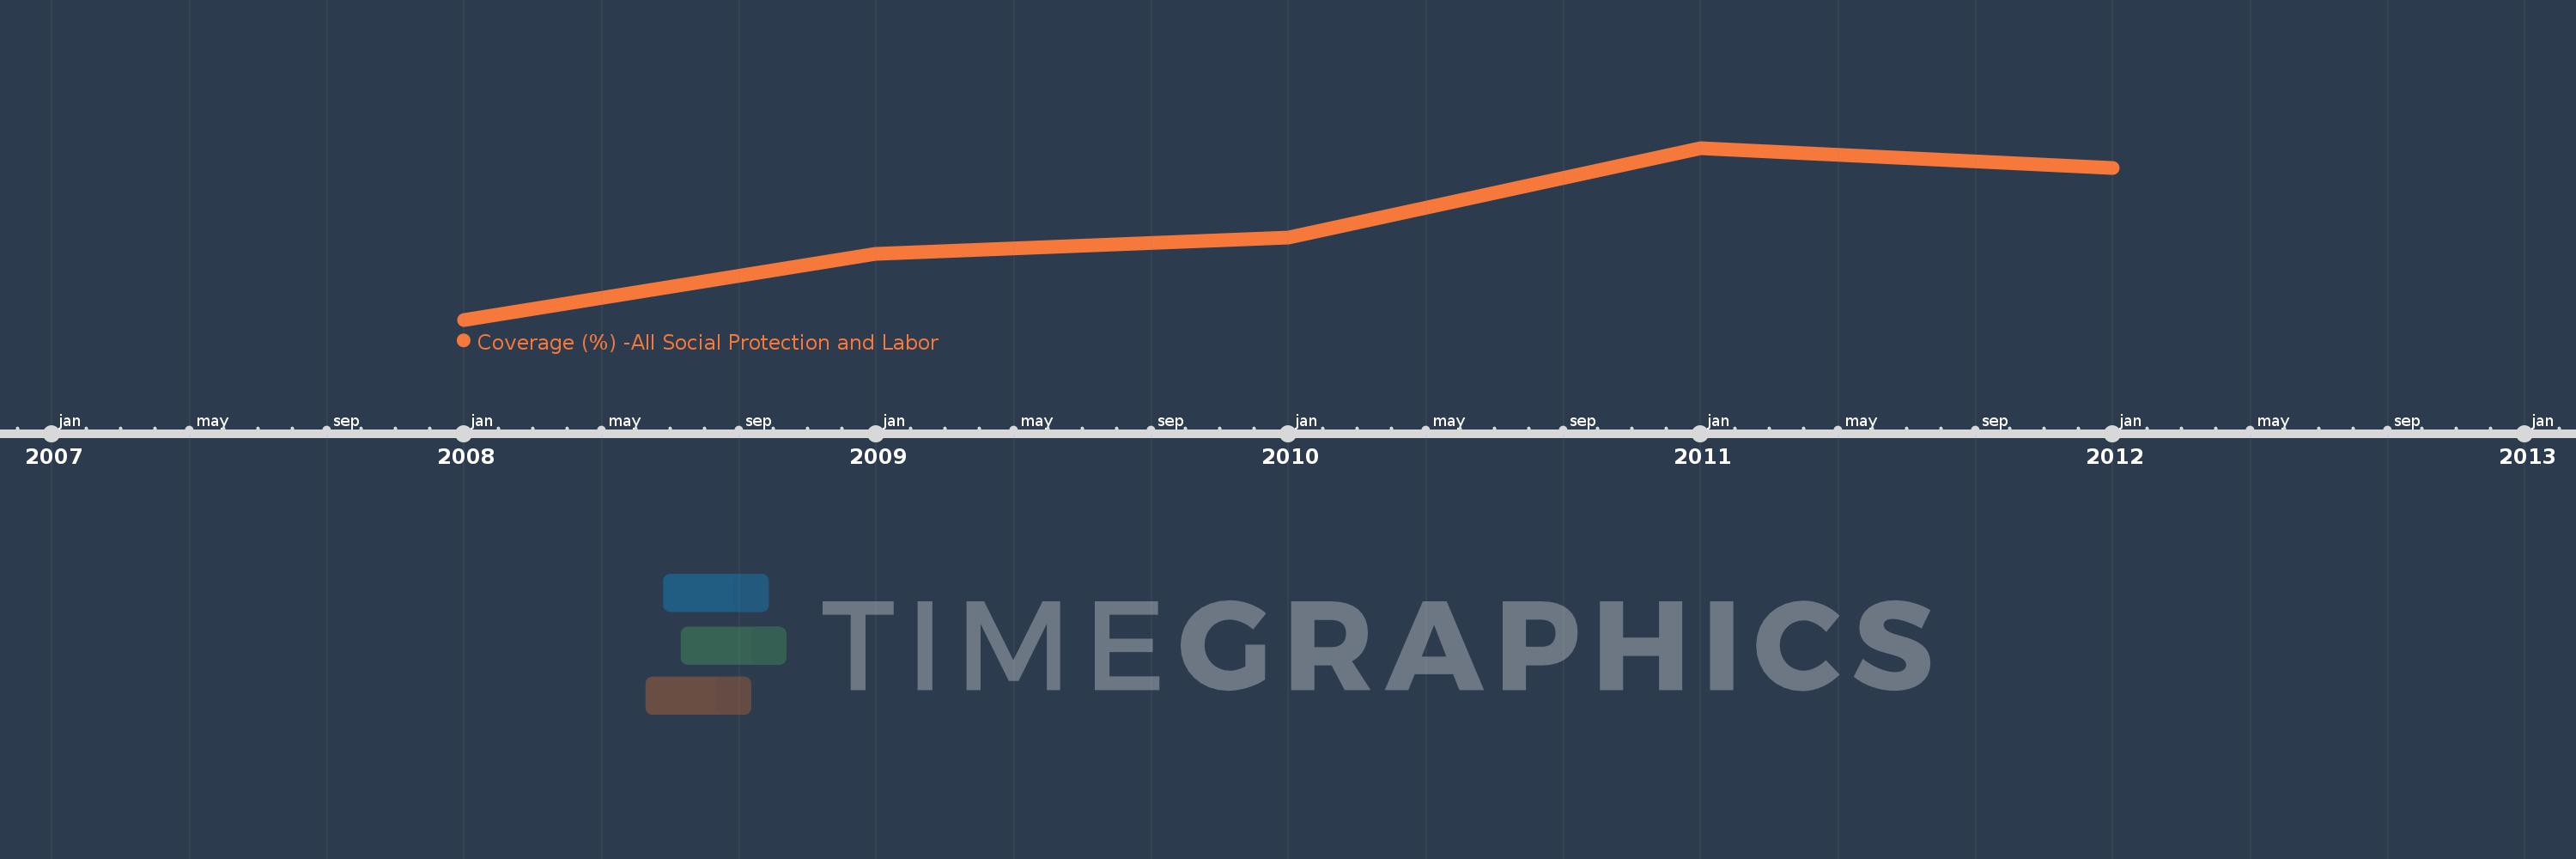
This timeline shows a graph from 2008 to 2012 of Paraguay. No data until 2007. Number of actual observations by date: 5.
Source name:
World Development Indicators
Source organization:
The Atlas of Social Protection: Indicators of Resilience and Equity (ASPIRE)
Categories, topics:
Social Protection & Labor
Last updated:
apr 23, 2017
Indicators value changes by year
Minimum:
37.178
jan 1, 2008
Maximum:
54.218
jan 1, 2011
At the date of observation
Value
Absolute change
Change from previous value
jan 1, 2008
37.178
+37.178
0.0%
jan 1, 2009
43.724
+6.547
17.61%
jan 1, 2010
45.374
+1.65
3.77%
jan 1, 2011
54.218
+8.843
19.49%
jan 1, 2012
52.27
-1.947
-3.59%
Ranking of countries by current statistics by years


Comments: