29
/
en
AIzaSyAYiBZKx7MnpbEhh9jyipgxe19OcubqV5w
April 1, 2024
121927
Dominican Republic
DOM
true
2
1
Coverage (%) -All Social Protection and Labor
2013,2012,2011,2010,2009,2008
This statistics in other country:
Timeline:
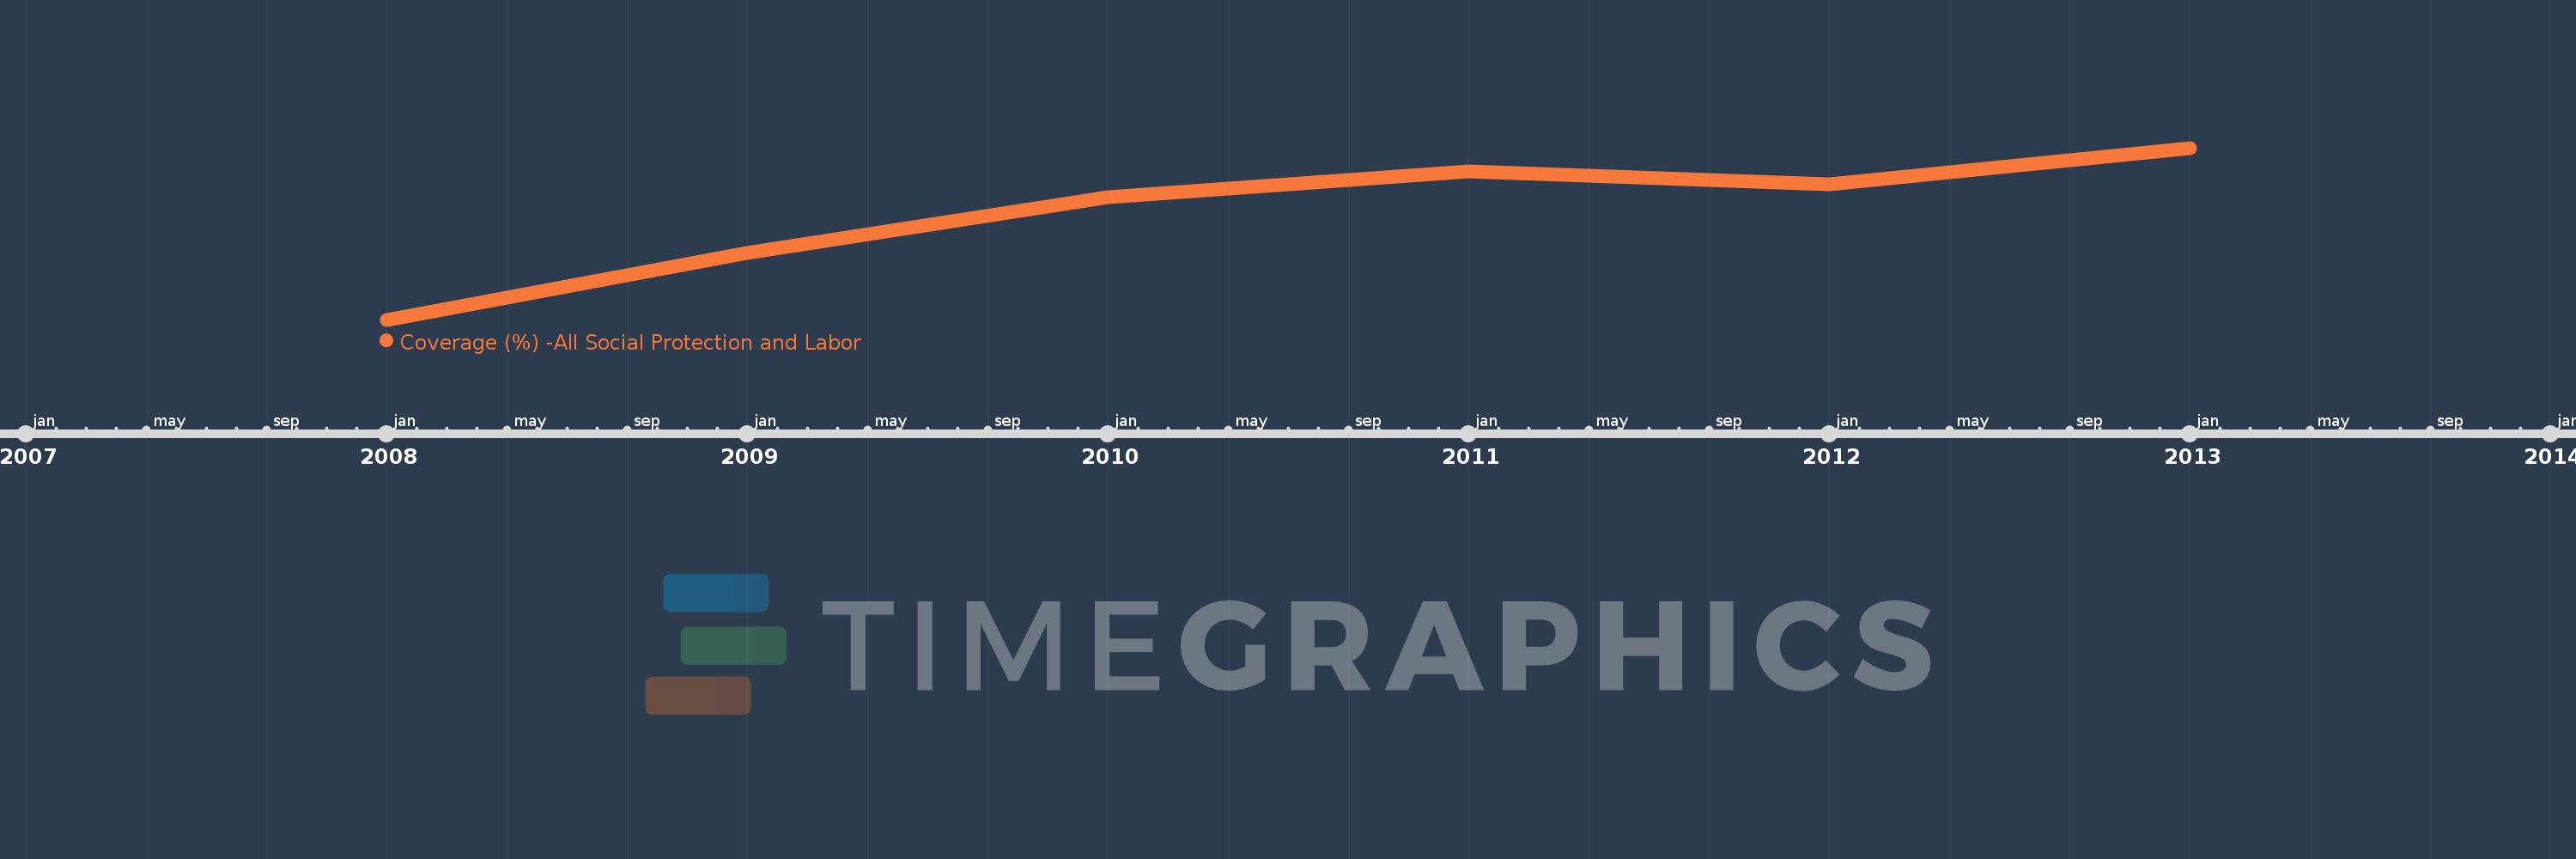
This timeline shows a graph from 2008 to 2013 of Dominican Republic. No data until 2007. Number of actual observations by date: 6.
Source name:
World Development Indicators
Source organization:
The Atlas of Social Protection: Indicators of Resilience and Equity (ASPIRE)
Categories, topics:
Social Protection & Labor
Last updated:
apr 23, 2017
Indicators value changes by year
Minimum:
15.238
jan 1, 2008
Maximum:
35.548
jan 1, 2013
At the date of observation
Value
Absolute change
Change from previous value
jan 1, 2008
15.238
+15.238
0.0%
jan 1, 2009
23.146
+7.908
51.89%
jan 1, 2010
29.704
+6.558
28.33%
jan 1, 2011
32.727
+3.023
10.18%
jan 1, 2012
31.276
-1.451
-4.43%
jan 1, 2013
35.548
+4.272
13.66%
Ranking of countries by current statistics by years


Comments: