29
/
en
AIzaSyAYiBZKx7MnpbEhh9jyipgxe19OcubqV5w
April 1, 2024
215379
Oman
OMN
true
2
1
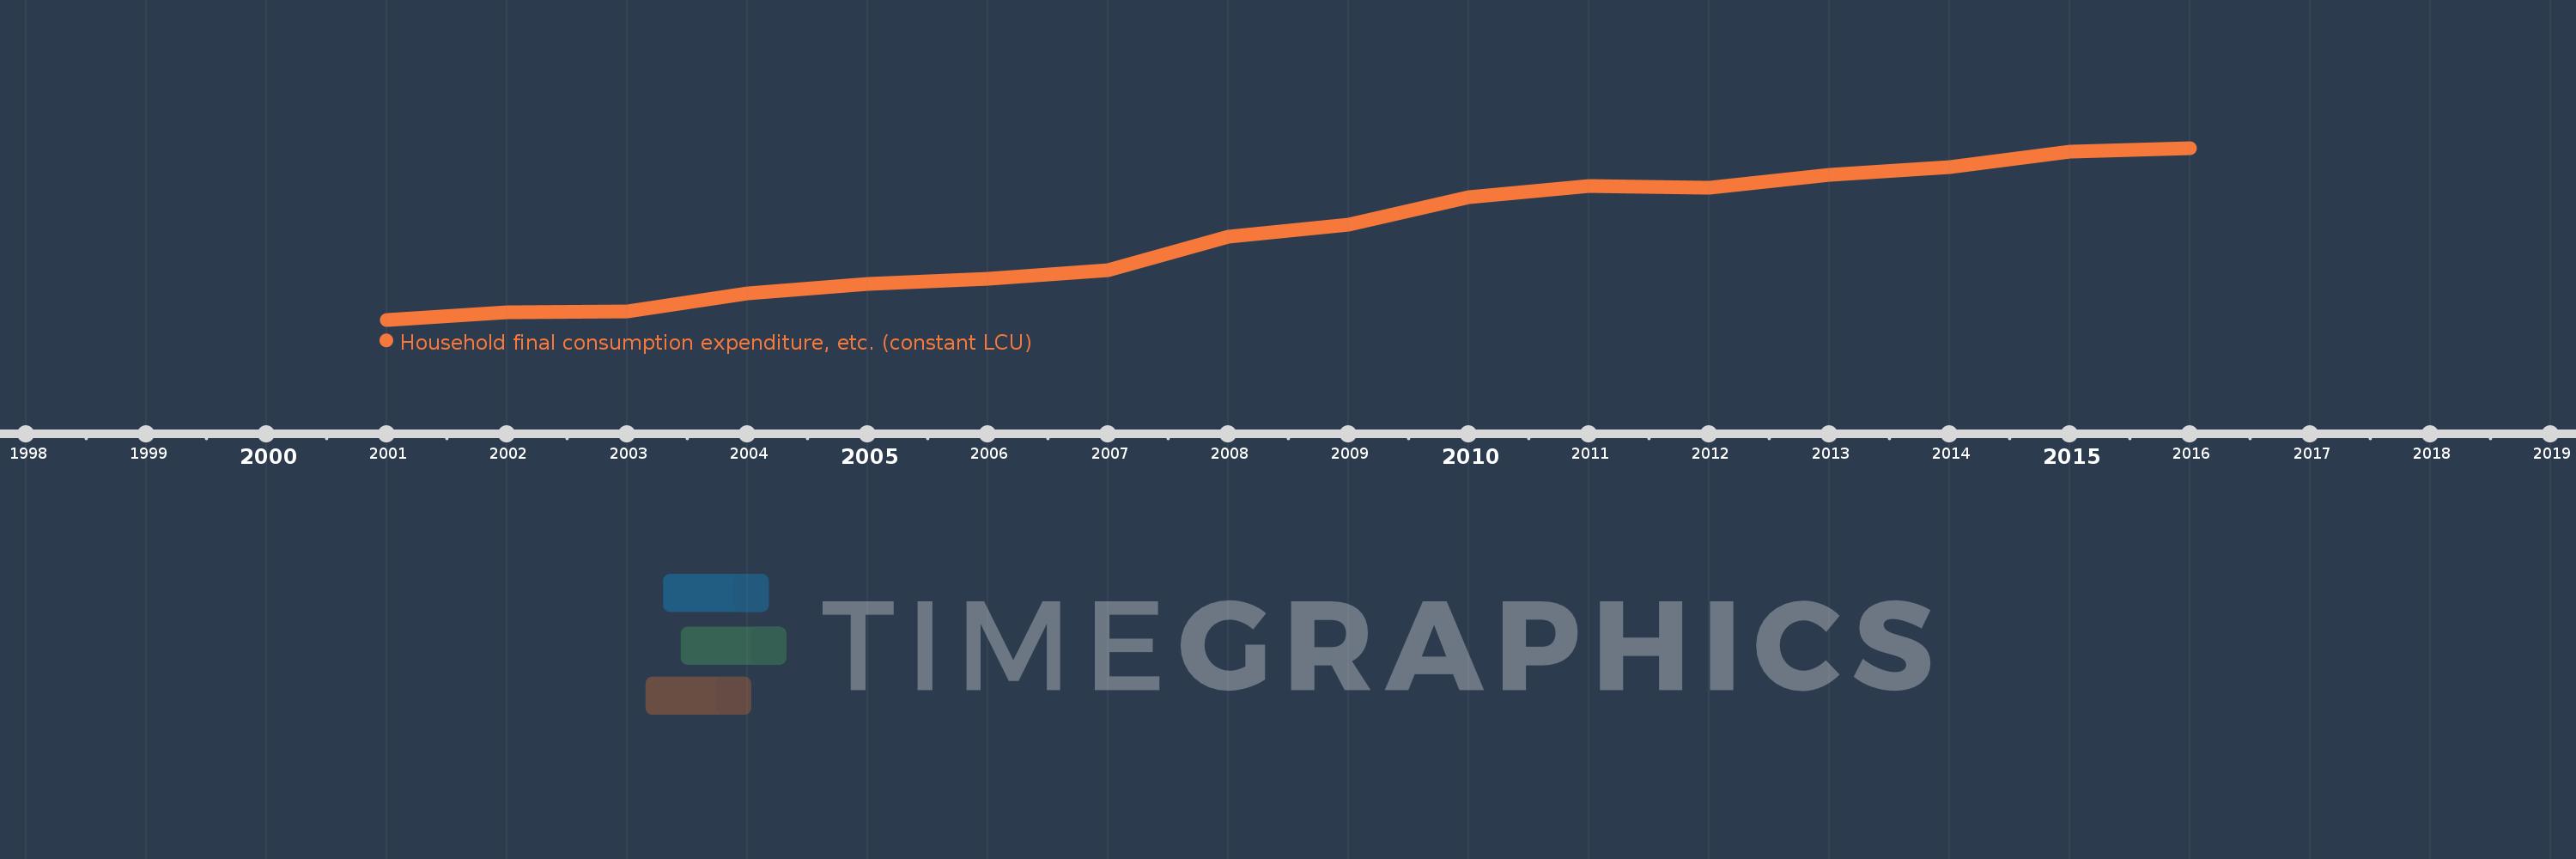
Household final consumption expenditure, etc. (constant LCU)
2016,2015,2014,2013,2012,2011,2010,2009,2008,2007,2006,2005,2004,2003,2002,2001
This statistics in other country:
AlbaniaAlgeriaAngolaAntigua and BarbudaArgentinaArmeniaAustraliaAustriaAzerbaijanBahamas, TheBahrainBangladeshBarbadosBelarusBelgiumBelizeBeninBhutanBoliviaBosnia and HerzegovinaBotswanaBrazilBrunei DarussalamBulgariaBurkina FasoBurundiCabo VerdeCambodiaCameroonCanadaChadChileColombiaComorosCongo, Dem. Rep.Congo, Rep.Costa RicaCote d'IvoireCroatiaCubaCyprusCzech RepublicDenmarkDjiboutiDominican RepublicEcuadorEgypt, Arab Rep.El SalvadorEquatorial GuineaEritreaEstoniaEthiopiaFijiFinlandFranceGabonGambia, TheGeorgiaGermanyGhanaGreeceGuatemalaGuineaGuinea-BissauHaitiHondurasHong Kong SAR, ChinaHungaryIcelandIndiaIndonesiaIran, Islamic Rep.IrelandIsraelItalyJamaicaJapanJordanKazakhstanKenyaKorea, Rep.KosovoKuwaitKyrgyz RepublicLao PDRLatviaLebanonLiberiaLithuaniaLuxembourgMacao SAR, ChinaMacedonia, FYRMadagascarMalawiMalaysiaMaliMaltaMarshall IslandsMauritaniaMauritiusMexicoMoldovaMongoliaMontenegroMoroccoMozambiqueNamibiaNepalNetherlandsNew ZealandNicaraguaNigerNigeriaNorwayOmanPakistanPanamaPapua New GuineaParaguayPeruPhilippinesPolandPortugalPuerto RicoQatarRomaniaRussian FederationRwandaSaudi ArabiaSenegalSerbiaSeychellesSierra LeoneSingaporeSlovak RepublicSloveniaSomaliaSouth AfricaSouth SudanSpainSri LankaSudanSurinameSwazilandSwedenSwitzerlandSyrian Arab RepublicTajikistanTanzaniaThailandTimor-LesteTogoTrinidad and TobagoTunisiaTurkeyTurkmenistanUgandaUkraineUnited Arab EmiratesUnited KingdomUnited StatesUruguayVanuatuVenezuela, RBVietnamWest Bank and GazaZambiaZimbabwe Timeline:
This timeline shows a graph from 2001 to 2016 of Oman. No data until 2000. Number of actual observations by date: 16.
Source name:
World Development Indicators
Source organization:
World Bank national accounts data, and OECD National Accounts data files.
Categories, topics:
Economy & Growth
Last updated:
apr 23, 2017
Indicators value changes by year
Minimum:
3.53 bln
jan 1, 2001
Maximum:
8.272 bln
jan 1, 2016
At the date of observation
Value
Absolute change
Change from previous value
jan 1, 2001
3.53 bln
+3.53 bln
0.0%
jan 1, 2002
3.725 bln
+195.5 mln
5.54%
jan 1, 2003
3.748 bln
+23.1 mln
0.62%
jan 1, 2004
4.267 bln
+518.3 mln
13.83%
jan 1, 2005
4.53 bln
+263.6 mln
6.18%
jan 1, 2006
4.657 bln
+126.2 mln
2.79%
jan 1, 2007
4.887 bln
+230.8 mln
4.96%
jan 1, 2008
5.83 bln
+942.6 mln
19.29%
jan 1, 2009
6.158 bln
+328.0 mln
5.63%
jan 1, 2010
6.925 bln
+766.6 mln
12.45%
jan 1, 2011
7.213 bln
+288.7 mln
4.17%
jan 1, 2012
7.167 bln
-46.5 mln
-0.64%
jan 1, 2013
7.518 bln
+351.3 mln
4.9%
jan 1, 2014
7.739 bln
+221.0 mln
2.94%
jan 1, 2015
8.174 bln
+435.0 mln
5.62%
jan 1, 2016
8.272 bln
+98.0 mln
1.2%
Ranking of countries by current statistics by years


Comments: