29
/
en
AIzaSyAYiBZKx7MnpbEhh9jyipgxe19OcubqV5w
April 1, 2024
127444
Equatorial Guinea
GNQ
true
2
1
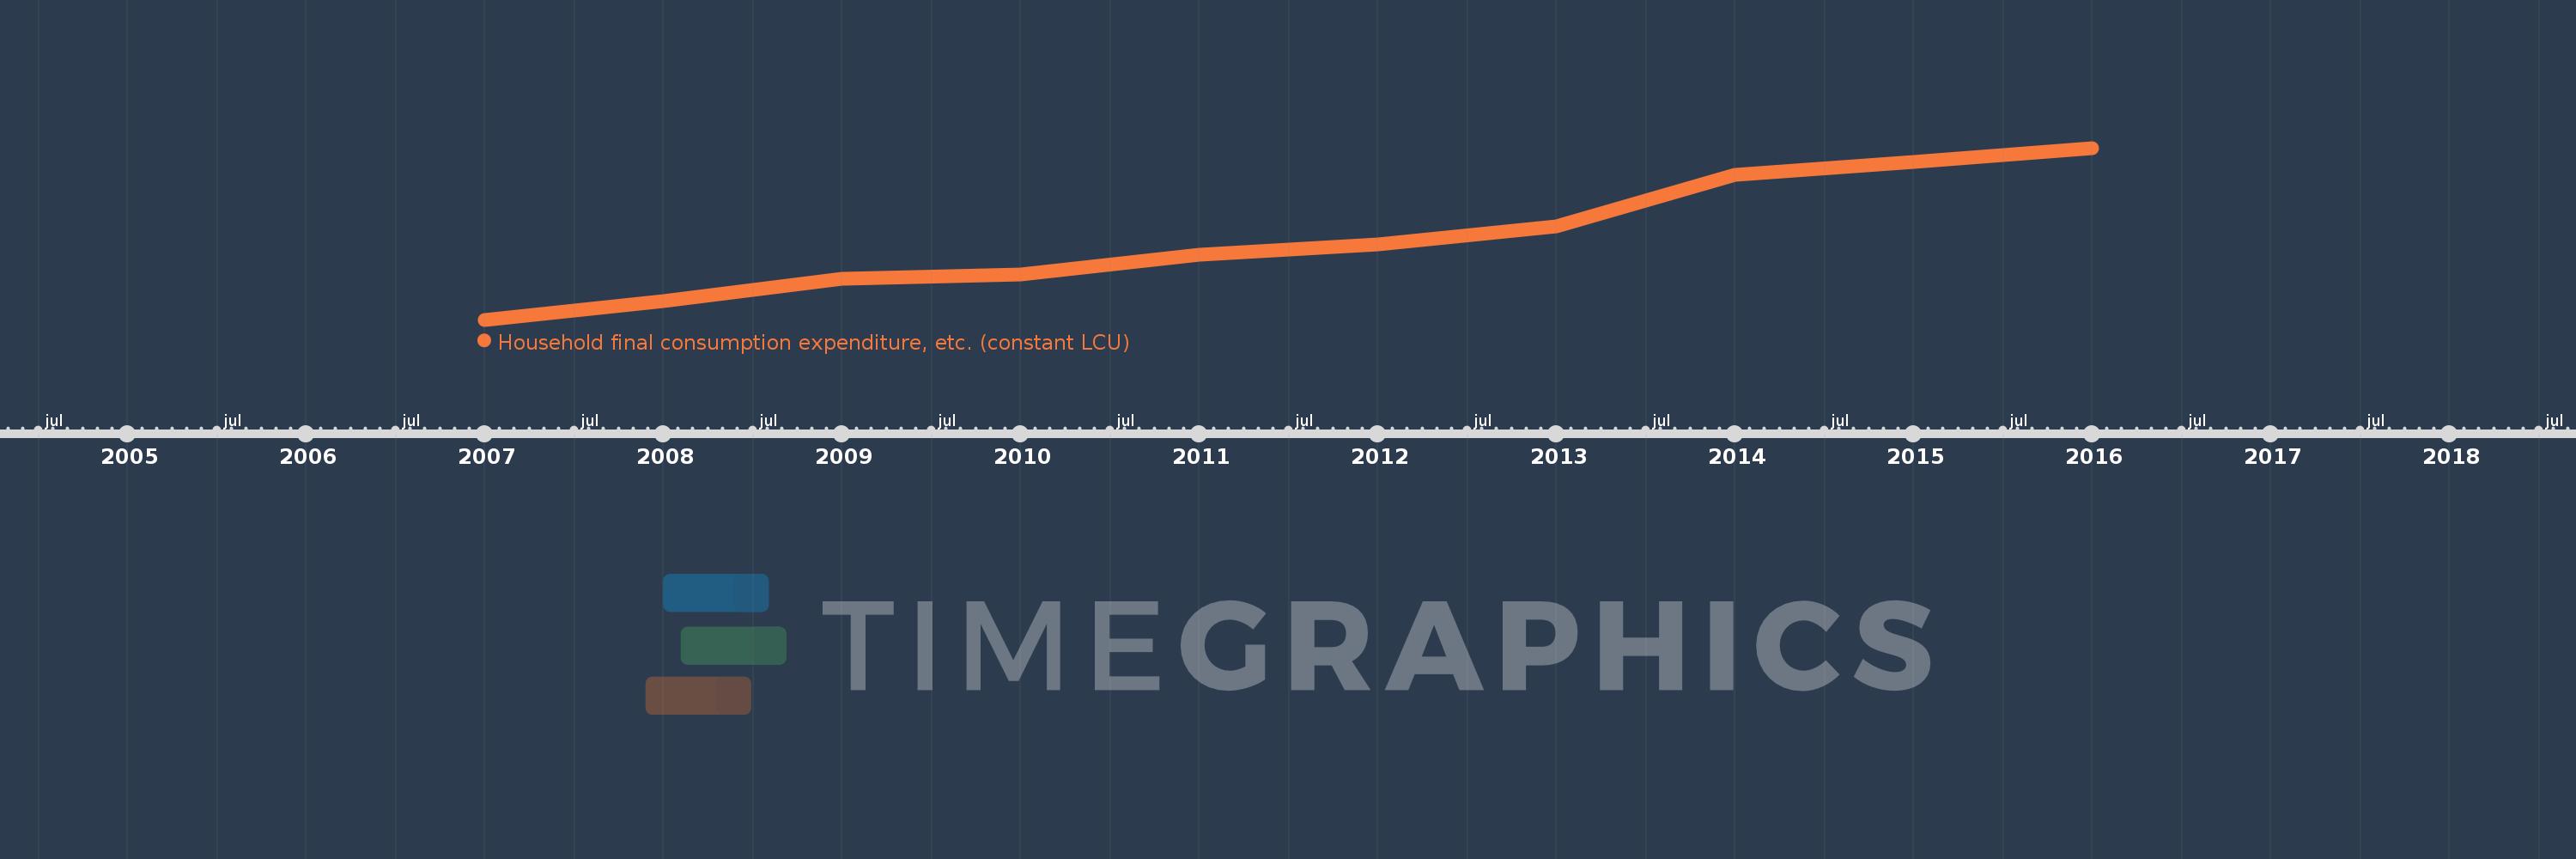
Household final consumption expenditure, etc. (constant LCU)
2016,2015,2014,2013,2012,2011,2010,2009,2008,2007
This statistics in other country:
AlbaniaAlgeriaAngolaAntigua and BarbudaArgentinaArmeniaAustraliaAustriaAzerbaijanBahamas, TheBahrainBangladeshBarbadosBelarusBelgiumBelizeBeninBhutanBoliviaBosnia and HerzegovinaBotswanaBrazilBrunei DarussalamBulgariaBurkina FasoBurundiCabo VerdeCambodiaCameroonCanadaChadChileColombiaComorosCongo, Dem. Rep.Congo, Rep.Costa RicaCote d'IvoireCroatiaCubaCyprusCzech RepublicDenmarkDjiboutiDominican RepublicEcuadorEgypt, Arab Rep.El SalvadorEquatorial GuineaEritreaEstoniaEthiopiaFijiFinlandFranceGabonGambia, TheGeorgiaGermanyGhanaGreeceGuatemalaGuineaGuinea-BissauHaitiHondurasHong Kong SAR, ChinaHungaryIcelandIndiaIndonesiaIran, Islamic Rep.IrelandIsraelItalyJamaicaJapanJordanKazakhstanKenyaKorea, Rep.KosovoKuwaitKyrgyz RepublicLao PDRLatviaLebanonLiberiaLithuaniaLuxembourgMacao SAR, ChinaMacedonia, FYRMadagascarMalawiMalaysiaMaliMaltaMarshall IslandsMauritaniaMauritiusMexicoMoldovaMongoliaMontenegroMoroccoMozambiqueNamibiaNepalNetherlandsNew ZealandNicaraguaNigerNigeriaNorwayOmanPakistanPanamaPapua New GuineaParaguayPeruPhilippinesPolandPortugalPuerto RicoQatarRomaniaRussian FederationRwandaSaudi ArabiaSenegalSerbiaSeychellesSierra LeoneSingaporeSlovak RepublicSloveniaSomaliaSouth AfricaSouth SudanSpainSri LankaSudanSurinameSwazilandSwedenSwitzerlandSyrian Arab RepublicTajikistanTanzaniaThailandTimor-LesteTogoTrinidad and TobagoTunisiaTurkeyTurkmenistanUgandaUkraineUnited Arab EmiratesUnited KingdomUnited StatesUruguayVanuatuVenezuela, RBVietnamWest Bank and GazaZambiaZimbabwe Timeline:
This timeline shows a graph from 2007 to 2016 of Equatorial Guinea. No data until 2006. Number of actual observations by date: 10.
Source name:
World Development Indicators
Source organization:
World Bank national accounts data, and OECD National Accounts data files.
Categories, topics:
Economy & Growth
Last updated:
apr 23, 2017
Indicators value changes by year
Minimum:
1.061 trl
jan 1, 2007
Maximum:
2.004 trl
jan 1, 2016
At the date of observation
Value
Absolute change
Change from previous value
jan 1, 2007
1.061 trl
+1.061 trl
0.0%
jan 1, 2008
1.164 trl
+103.43 bln
9.75%
jan 1, 2009
1.287 trl
+122.709 bln
10.54%
jan 1, 2010
1.307 trl
+20.404 bln
1.59%
jan 1, 2011
1.417 trl
+109.673 bln
8.39%
jan 1, 2012
1.474 trl
+56.895 bln
4.02%
jan 1, 2013
1.574 trl
+100.102 bln
6.79%
jan 1, 2014
1.855 trl
+281.343 bln
17.88%
jan 1, 2015
1.929 trl
+73.644 bln
3.97%
jan 1, 2016
2.004 trl
+75.277 bln
3.9%
Ranking of countries by current statistics by years


Comments: