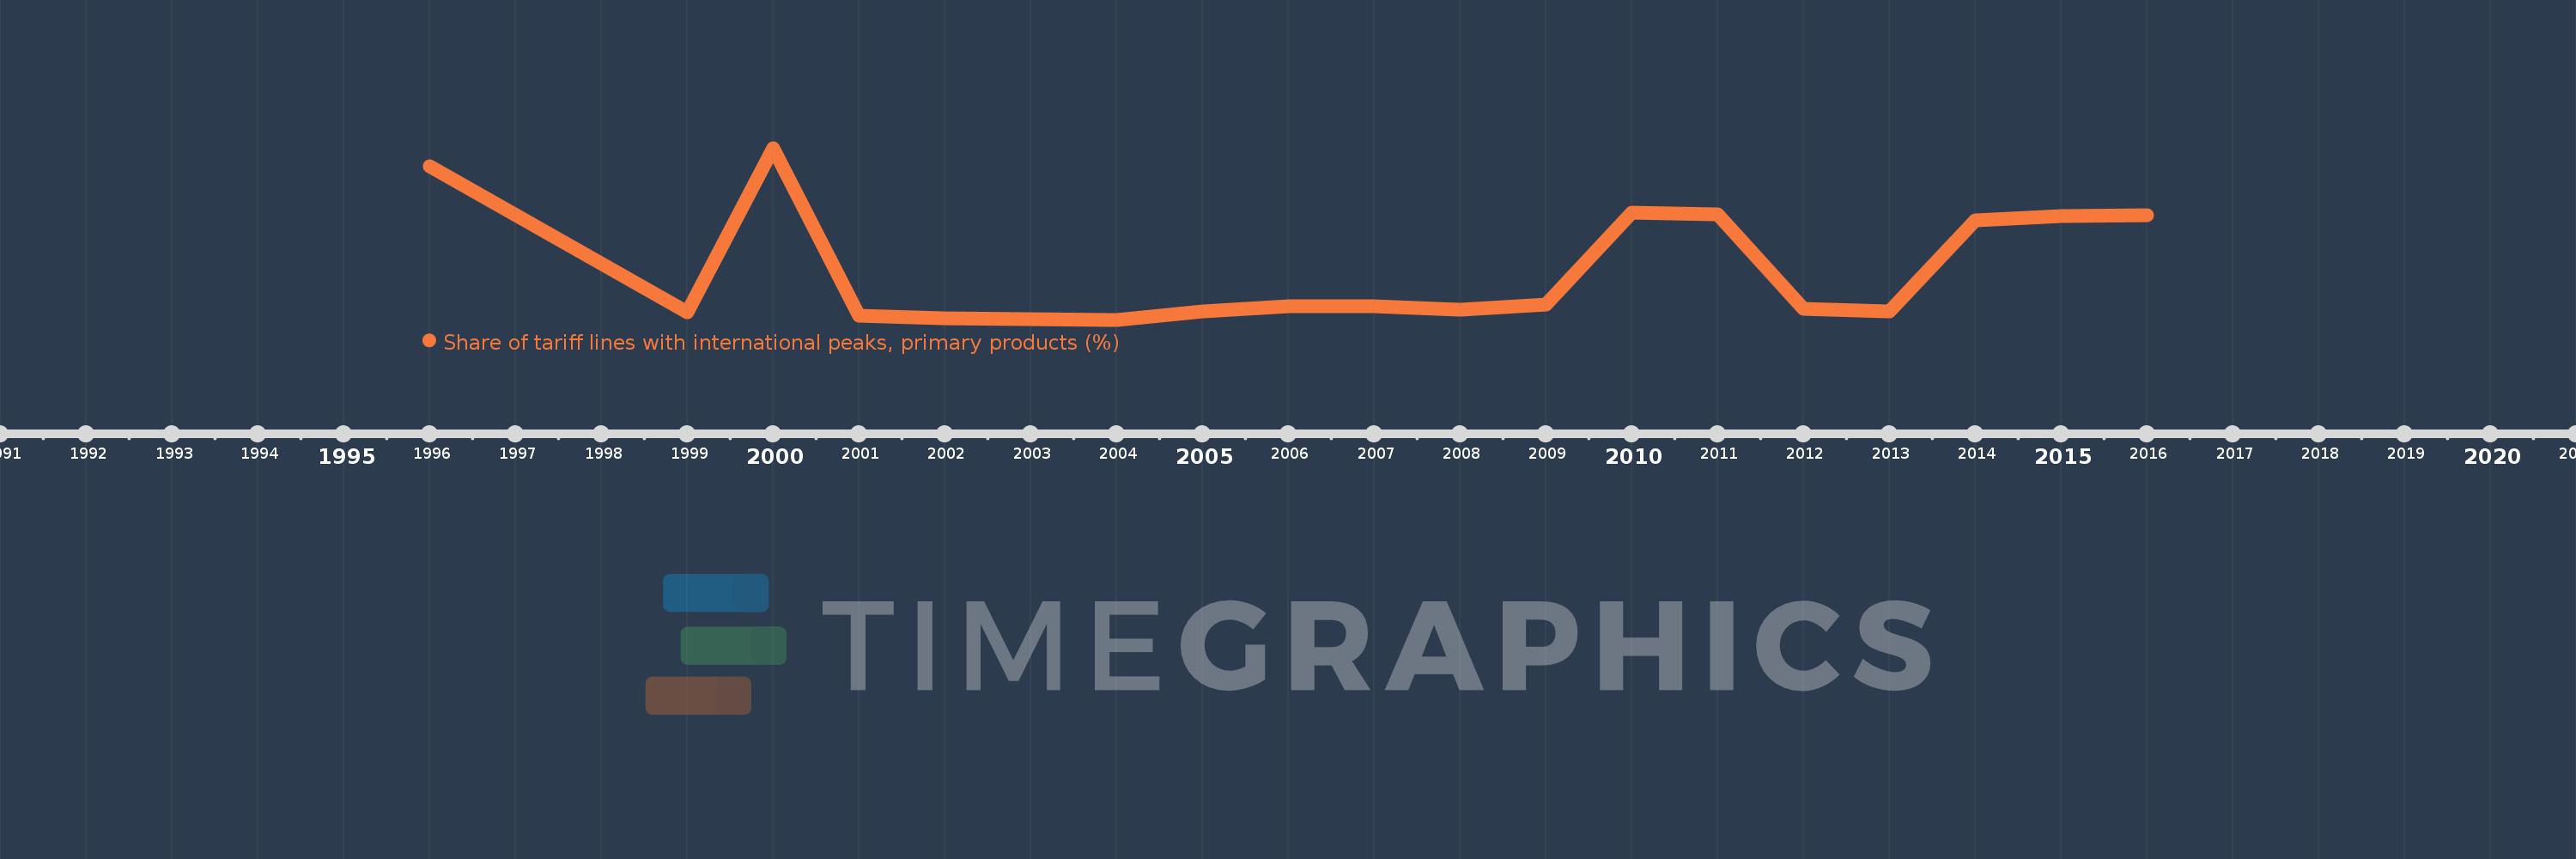
This timeline shows a graph from 1996 to 2016 of Nicaragua. No data until 1995. Number of actual observations by date: 19.
Source name:
World Development Indicators
Source organization:
World Bank staff estimates using the World Integrated Trade Solution system, based on data from United Nations Conference on Trade and Development's Trade Analysis and Information System (TRAINS) database.
Categories, topics:
Private Sector, Trade
Last updated:
apr 23, 2017
Indicators value changes by year
Meaning:
11.149
Minimum:
1.164
jan 1, 2004
Maximum:
35.861
jan 1, 2000
At the date of observation
Value
Absolute change
Change from the previous value
jan 1, 1996
32.144
+32.144
0.0%
jan 1, 1999
2.718
-29.426
-91.54%
jan 1, 2000
35.861
+33.142
1.22K%
jan 1, 2001
1.909
-33.952
-94.68%
jan 1, 2002
1.508
-0.401
-21.0%
jan 1, 2003
1.286
-0.222
-14.72%
jan 1, 2004
1.164
-0.122
-9.5%
jan 1, 2005
2.828
+1.664
142.99%
jan 1, 2006
3.967
+1.139
40.29%
jan 1, 2007
3.899
-0.068
-1.72%
jan 1, 2008
3.21
-0.689
-17.66%
jan 1, 2009
4.222
+1.012
31.53%
jan 1, 2010
22.799
+18.577
439.96%
jan 1, 2011
22.51
-0.29
-1.27%
jan 1, 2012
3.43
-19.08
-84.76%
jan 1, 2013
2.782
-0.648
-18.9%
jan 1, 2014
21.273
+18.491
664.78%
jan 1, 2015
22.1
+0.827
3.89%
jan 1, 2016
22.228
+0.129
0.58%
Ranking of countries by current statistics by years
