30
/
AIzaSyAYiBZKx7MnpbEhh9jyipgxe19OcubqV5w
April 1, 2024
155338
India
IND
true
2
1
Share of tariff lines with international peaks, primary products (%)
2014,2013,2012,2011,2010,2009,2008,2007,2006,2005,2004,2003,2002,2001,2000,1998,1993,1991
Download
Global statistics library →India →

Share of tariff lines with international peaks, primary products (%)

This statistics in other country:

AfghanistanAlbaniaAlgeriaAngolaAntigua and BarbudaArgentinaArmeniaArubaAustraliaAustriaAzerbaijanBahamas, TheBahrainBangladeshBarbadosBelarusBelgiumBelizeBeninBermudaBhutanBoliviaBosnia and HerzegovinaBotswanaBrazilBrunei DarussalamBulgariaBurkina FasoBurundiCabo VerdeCambodiaCameroonCanadaCentral African RepublicChadChileChinaColombiaComorosCongo, Dem. Rep.Congo, Rep.Costa RicaCote d'IvoireCroatiaCubaCyprusCzech RepublicDenmarkDjiboutiDominicaDominican RepublicEast Asia & Pacific (excluding high income)EcuadorEgypt, Arab Rep.El SalvadorEquatorial GuineaEritreaEstoniaEthiopiaEurope & Central Asia (excluding high income)European UnionFijiFinlandFranceFrench PolynesiaGabonGambia, TheGeorgiaGermanyGhanaGreeceGrenadaGuatemalaGuineaGuinea-BissauGuyanaHaitiHigh incomeHondurasHong Kong SAR, ChinaHungaryIcelandIndiaIndonesiaIran, Islamic Rep.IrelandIsraelItalyJamaicaJapanJordanKazakhstanKenyaKorea, Rep.KuwaitKyrgyz RepublicLao PDRLatin America & Caribbean (excluding high income)LatviaLebanonLesothoLiberiaLibyaLithuaniaLow & middle incomeLow incomeLower middle incomeLuxembourgMacao SAR, ChinaMacedonia, FYRMadagascarMalawiMalaysiaMaldivesMaliMaltaMauritaniaMauritiusMexicoMiddle East & North Africa (excluding high income)Middle incomeMoldovaMongoliaMontenegroMoroccoMozambiqueMyanmarNamibiaNepalNetherlandsNew ZealandNicaraguaNigerNigeriaNorwayOECD membersOmanPakistanPalauPanamaPapua New GuineaParaguayPeruPhilippinesPolandPortugalQatarRomaniaRussian FederationRwandaSamoaSaudi ArabiaSenegalSerbiaSeychellesSierra LeoneSingaporeSlovak RepublicSloveniaSolomon IslandsSouth AfricaSouth AsiaSpainSri LankaSt. Kitts and NevisSt. LuciaSt. Vincent and the GrenadinesSub-Saharan Africa (excluding high income)SudanSurinameSwazilandSwedenSwitzerlandSyrian Arab RepublicTajikistanTanzaniaThailandTimor-LesteTogoTongaTrinidad and TobagoTunisiaTurkeyTurkmenistanTuvaluUgandaUkraineUnited Arab EmiratesUnited KingdomUnited StatesUpper middle incomeUruguayUzbekistanVanuatuVenezuela, RBVietnamWorldYemen, Rep.ZambiaZimbabwe

Timeline:

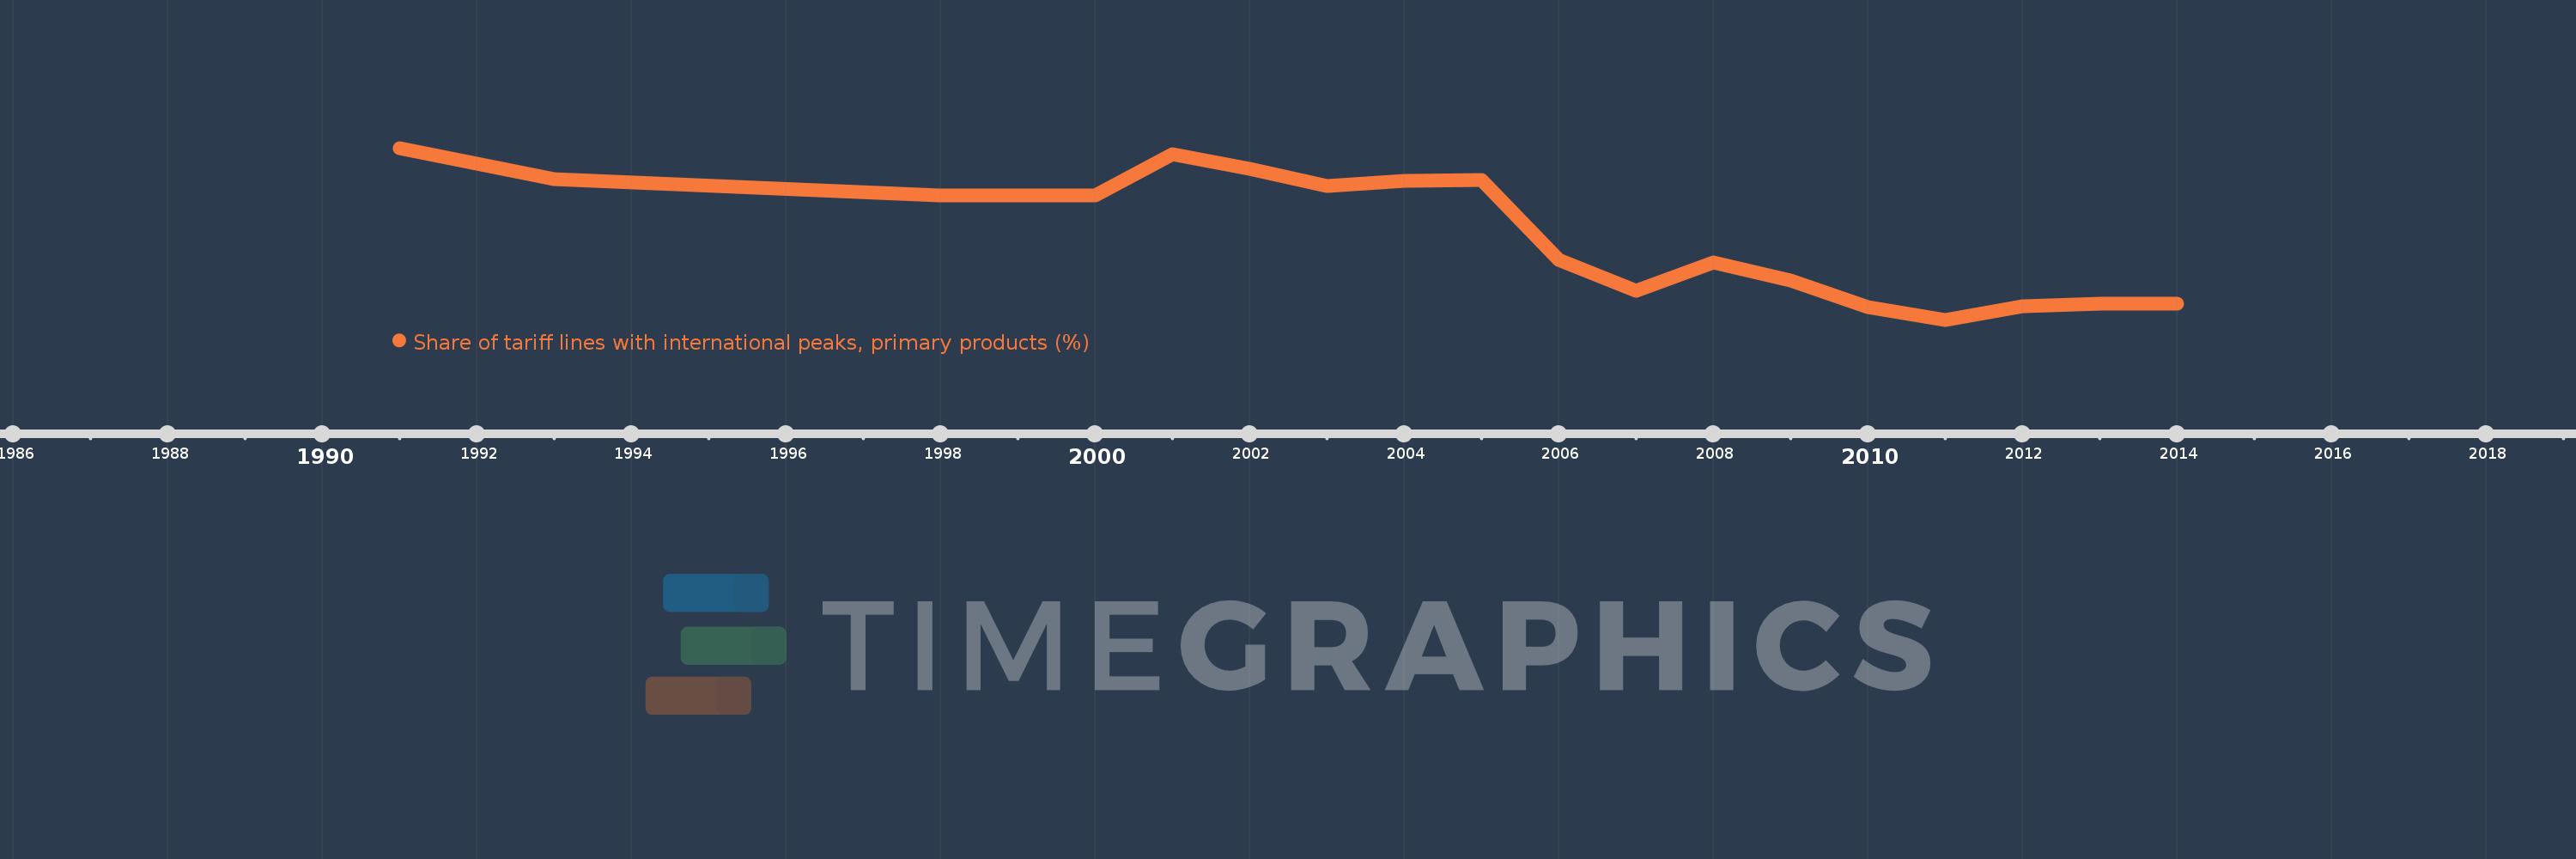
This timeline shows a graph from 1991 to 2014 of India. No data until 1990. Number of actual observations by date: 18.

Source name:

World Development Indicators

Source organization:

World Bank staff estimates using the World Integrated Trade Solution system, based on data from United Nations Conference on Trade and Development's Trade Analysis and Information System (TRAINS) database.

Categories, topics:

Private Sector, Trade

Last updated:

apr 23, 2017

Indicators value changes by year

Meaning:
60.496
Minimum:
31.95
jan 1, 2011
Maximum:
89.583
jan 1, 1991
At the date of observation
Value
Absolute change
Change from the previous value
jan 1, 1991
89.583
+89.583
0.0%
jan 1, 1993
79.115
-10.468
-11.69%
jan 1, 1998
73.659
-5.456
-6.9%
jan 1, 2000
73.776
+0.118
0.16%
jan 1, 2001
87.35
+13.574
18.4%
jan 1, 2002
82.536
-4.815
-5.51%
jan 1, 2003
76.924
-5.612
-6.8%
jan 1, 2004
78.57
+1.646
2.14%
jan 1, 2005
78.7
+0.13
0.17%
jan 1, 2006
51.982
-26.718
-33.95%
jan 1, 2007
41.703
-10.279
-19.77%
jan 1, 2008
51.084
+9.381
22.5%
jan 1, 2009
45.005
-6.079
-11.9%
jan 1, 2010
36.079
-8.926
-19.83%
jan 1, 2011
31.95
-4.129
-11.44%
jan 1, 2012
36.364
+4.414
13.82%
jan 1, 2013
37.299
+0.934
2.57%
jan 1, 2014
37.243
-0.056
-0.15%

Ranking of countries by current statistics by years