29
/
en
AIzaSyAYiBZKx7MnpbEhh9jyipgxe19OcubqV5w
April 1, 2024
199720
Mongolia
MNG
true
2
1
PPG, official creditors (TDS, current US$)
2016,2015,2014,2013,2012,2011,2010,2009,2008,2007,2006,2005,2004,2003,2002,2001,2000,1999,1998,1997,1996,1995,1994,1993
This statistics in other country:
Timeline:
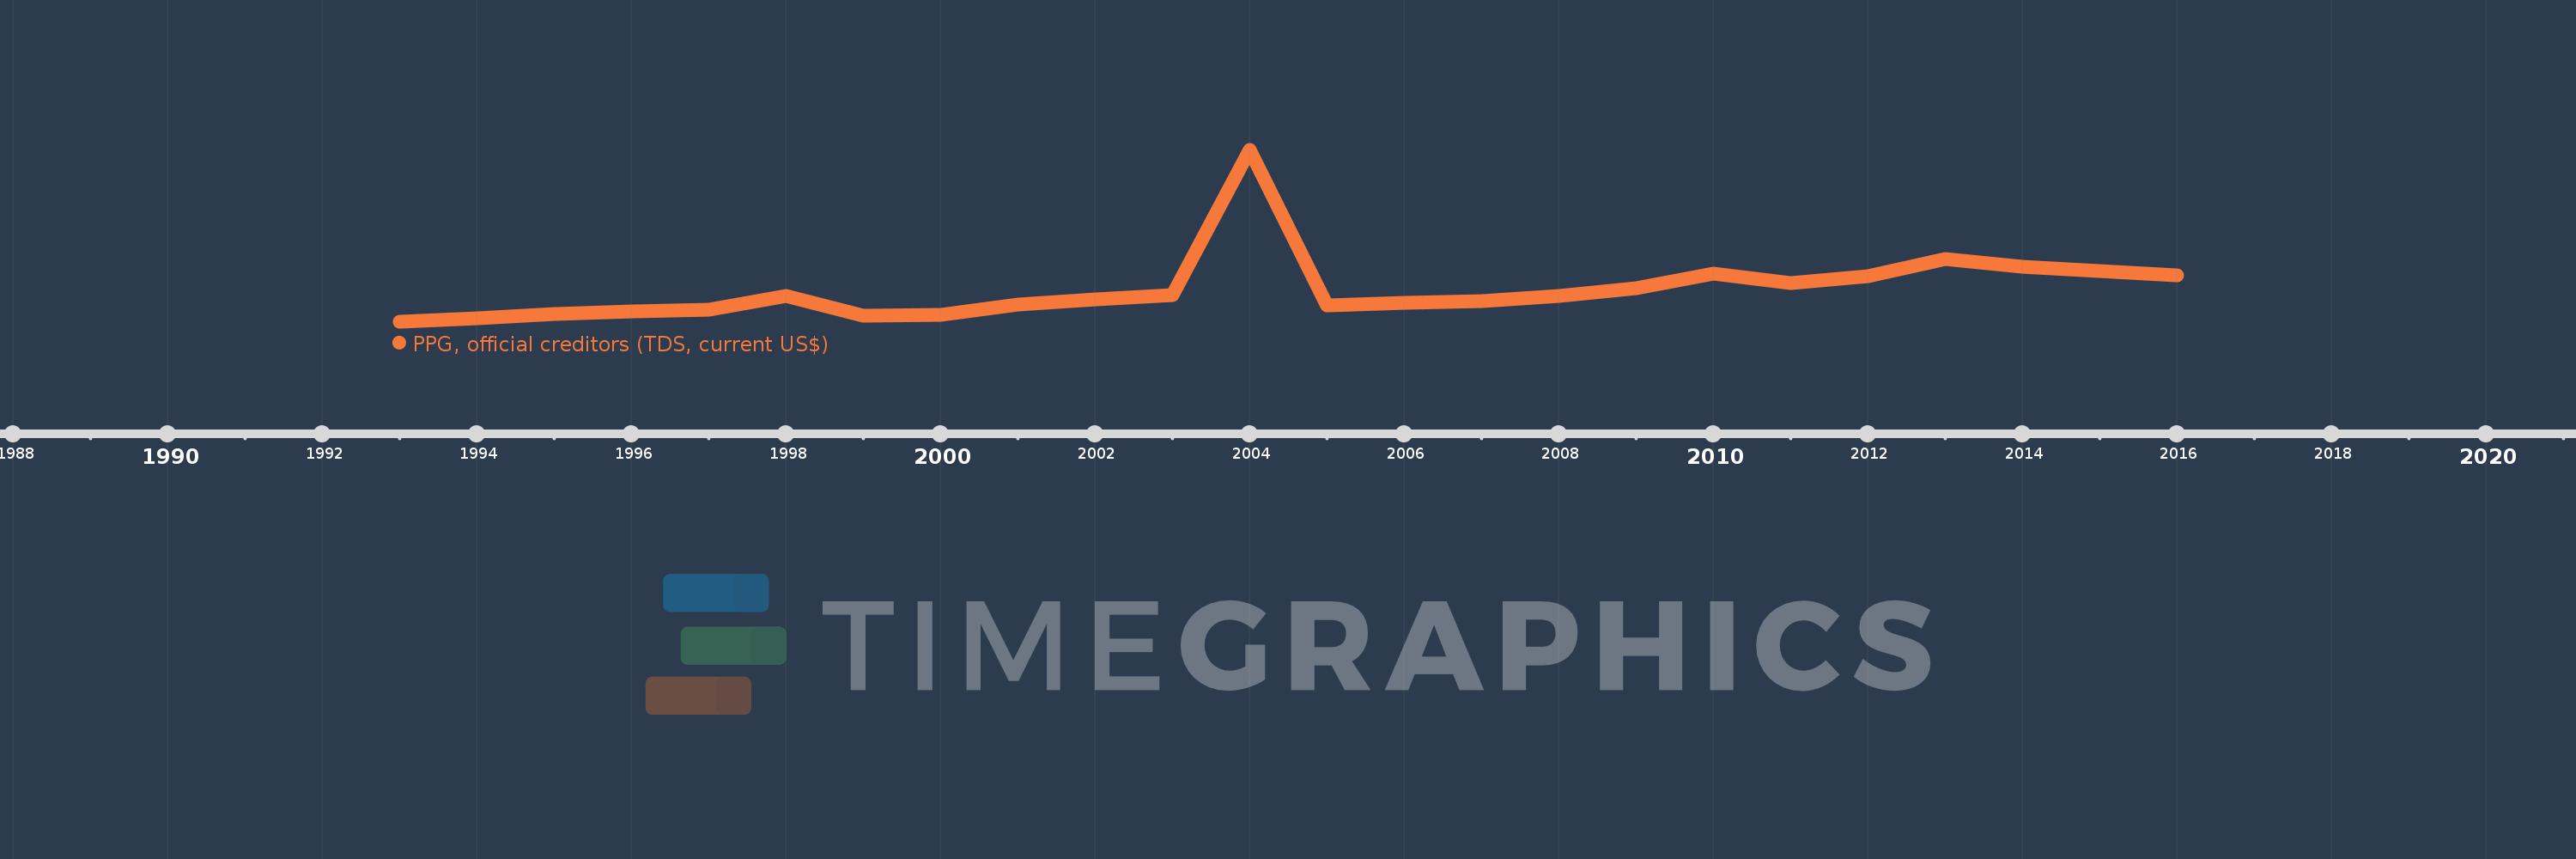
This timeline shows a graph from 1993 to 2016 of Mongolia. No data until 1992. Number of actual observations by date: 24.
Source name:
World Development Indicators
Source organization:
World Bank, International Debt Statistics.
Categories, topics:
External Debt
Last updated:
apr 23, 2017
Indicators value changes by year
Minimum:
677.0K
jan 1, 1993
Maximum:
277.318 mln
jan 1, 2004
At the date of observation
Value
Absolute change
Change from previous value
jan 1, 1993
677.0K
+677.0K
0.0%
jan 1, 1994
6.886 mln
+6.209 mln
917.13%
jan 1, 1995
13.882 mln
+6.996 mln
101.6%
jan 1, 1996
17.897 mln
+4.015 mln
28.92%
jan 1, 1997
20.092 mln
+2.195 mln
12.26%
jan 1, 1998
42.345 mln
+22.253 mln
110.76%
jan 1, 1999
11.404 mln
-30.941 mln
-73.07%
jan 1, 2000
12.7 mln
+1.296 mln
11.36%
jan 1, 2001
28.228 mln
+15.528 mln
122.27%
jan 1, 2002
36.472 mln
+8.244 mln
29.21%
jan 1, 2003
43.841 mln
+7.369 mln
20.2%
jan 1, 2004
277.318 mln
+233.477 mln
532.55%
jan 1, 2005
26.735 mln
-250.583 mln
-90.36%
jan 1, 2006
31.78 mln
+5.045 mln
18.87%
jan 1, 2007
34.506 mln
+2.726 mln
8.58%
jan 1, 2008
42.632 mln
+8.126 mln
23.55%
jan 1, 2009
55.105 mln
+12.473 mln
29.26%
jan 1, 2010
77.929 mln
+22.824 mln
41.42%
jan 1, 2011
63.242 mln
-14.687 mln
-18.85%
jan 1, 2012
74.58 mln
+11.338 mln
17.93%
jan 1, 2013
101.781 mln
+27.201 mln
36.47%
jan 1, 2014
90.105 mln
-11.676 mln
-11.47%
jan 1, 2015
82.112 mln
-7.993 mln
-8.87%
jan 1, 2016
75.758 mln
-6.354 mln
-7.74%
Ranking of countries by current statistics by years


Comments: