29
/
en
AIzaSyAYiBZKx7MnpbEhh9jyipgxe19OcubqV5w
April 1, 2024
75579
Azerbaijan
AZE
true
2
1
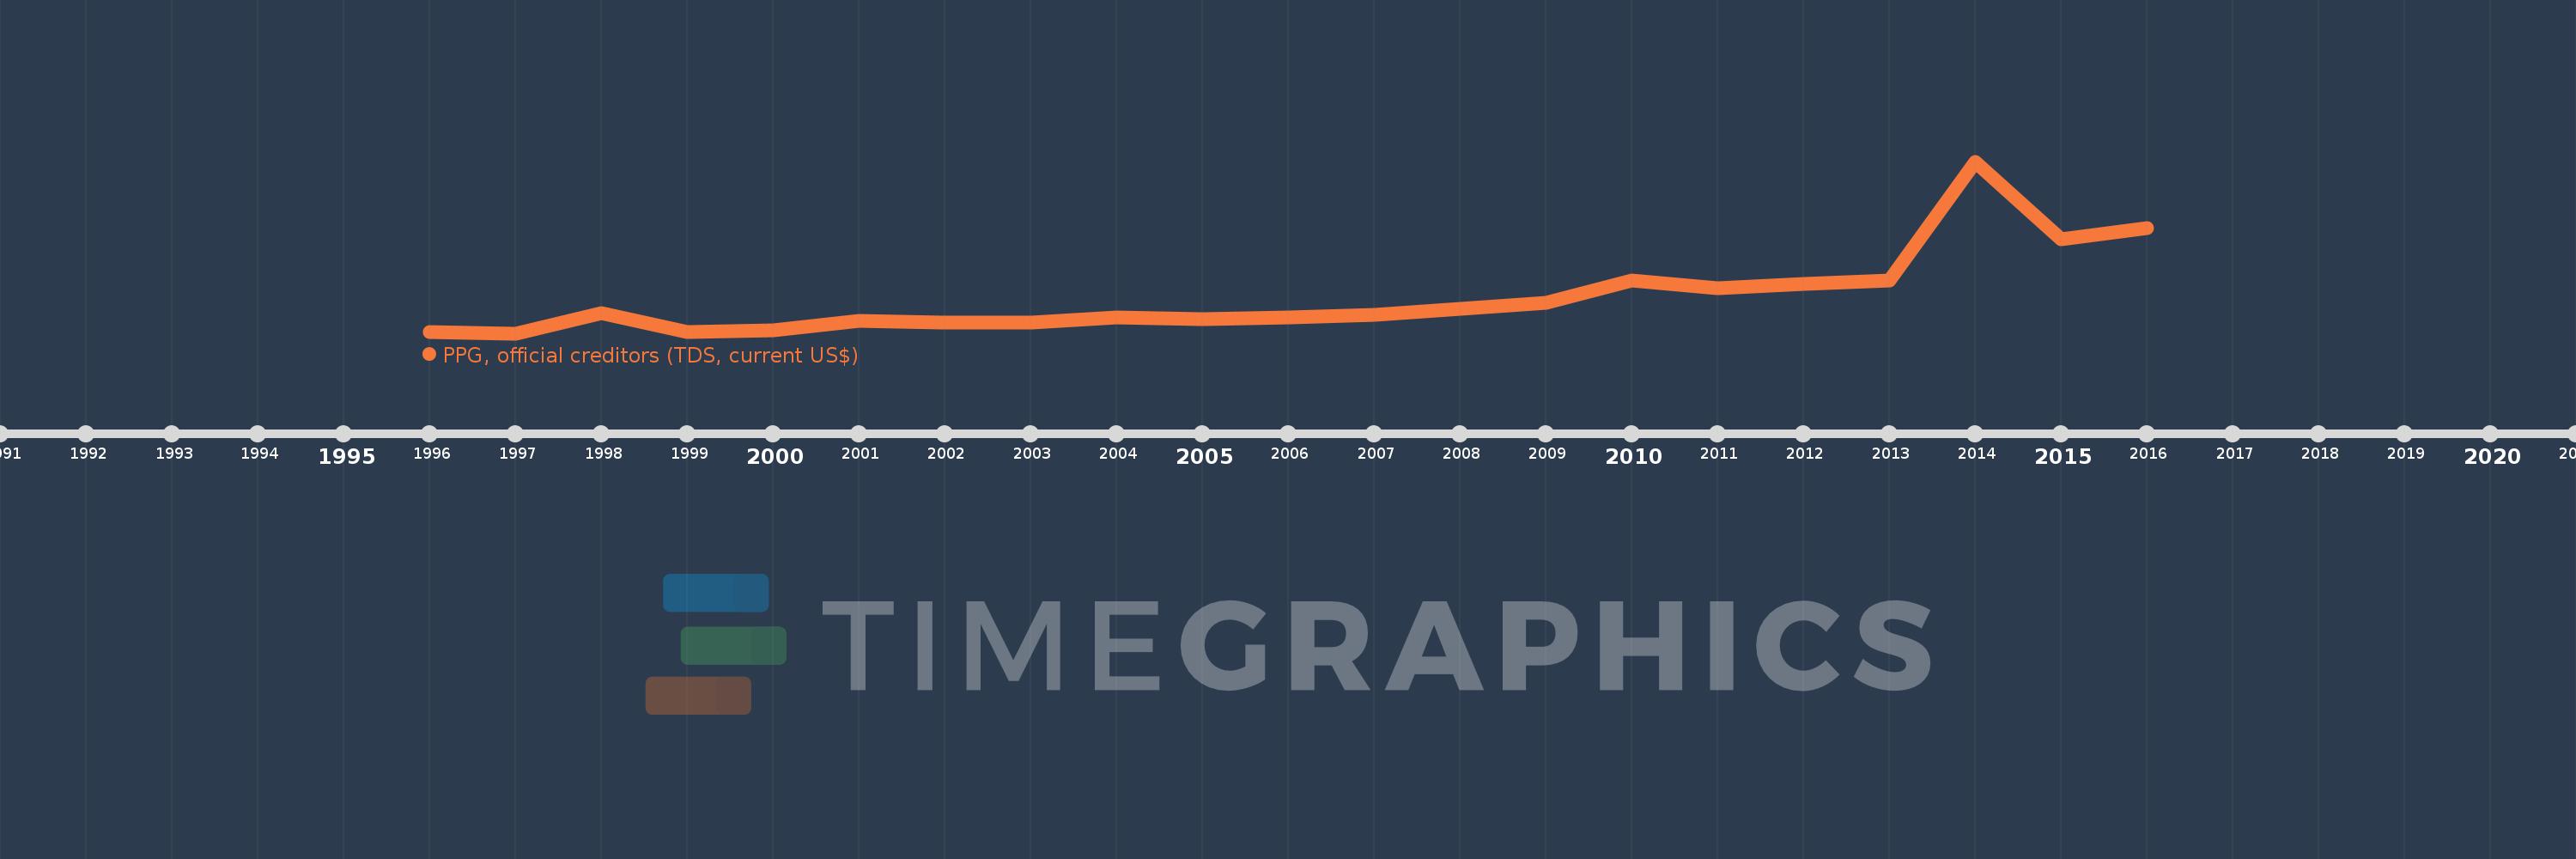
PPG, official creditors (TDS, current US$)
2016,2015,2014,2013,2012,2011,2010,2009,2008,2007,2006,2005,2004,2003,2002,2001,2000,1999,1998,1997,1996
This statistics in other country:
Timeline:
This timeline shows a graph from 1996 to 2016 of Azerbaijan. No data until 1995. Number of actual observations by date: 21.
Source name:
World Development Indicators
Source organization:
World Bank, International Debt Statistics.
Categories, topics:
External Debt
Last updated:
apr 23, 2017
Indicators value changes by year
Minimum:
4.323 mln
jan 1, 1997
Maximum:
546.338 mln
jan 1, 2014
At the date of observation
Value
Absolute change
Change from previous value
jan 1, 1996
8.692 mln
+8.692 mln
0.0%
jan 1, 1997
4.323 mln
-4.369 mln
-50.26%
jan 1, 1998
69.256 mln
+64.933 mln
1.5K%
jan 1, 1999
7.813 mln
-61.443 mln
-88.72%
jan 1, 2000
15.101 mln
+7.288 mln
93.28%
jan 1, 2001
43.226 mln
+28.125 mln
186.25%
jan 1, 2002
37.757 mln
-5.469 mln
-12.65%
jan 1, 2003
38.025 mln
+268.0K
0.71%
jan 1, 2004
53.794 mln
+15.769 mln
41.47%
jan 1, 2005
48.812 mln
-4.982 mln
-9.26%
jan 1, 2006
54.269 mln
+5.457 mln
11.18%
jan 1, 2007
63.397 mln
+9.128 mln
16.82%
jan 1, 2008
82.909 mln
+19.512 mln
30.78%
jan 1, 2009
101.191 mln
+18.282 mln
22.05%
jan 1, 2010
169.724 mln
+68.533 mln
67.73%
jan 1, 2011
145.321 mln
-24.403 mln
-14.38%
jan 1, 2012
160.271 mln
+14.95 mln
10.29%
jan 1, 2013
171.66 mln
+11.389 mln
7.11%
jan 1, 2014
546.338 mln
+374.678 mln
218.27%
jan 1, 2015
301.462 mln
-244.876 mln
-44.82%
jan 1, 2016
336.205 mln
+34.743 mln
11.52%
Ranking of countries by current statistics by years


Comments: