29
/
en
AIzaSyAYiBZKx7MnpbEhh9jyipgxe19OcubqV5w
April 1, 2024
199642
Mongolia
MNG
true
2
1
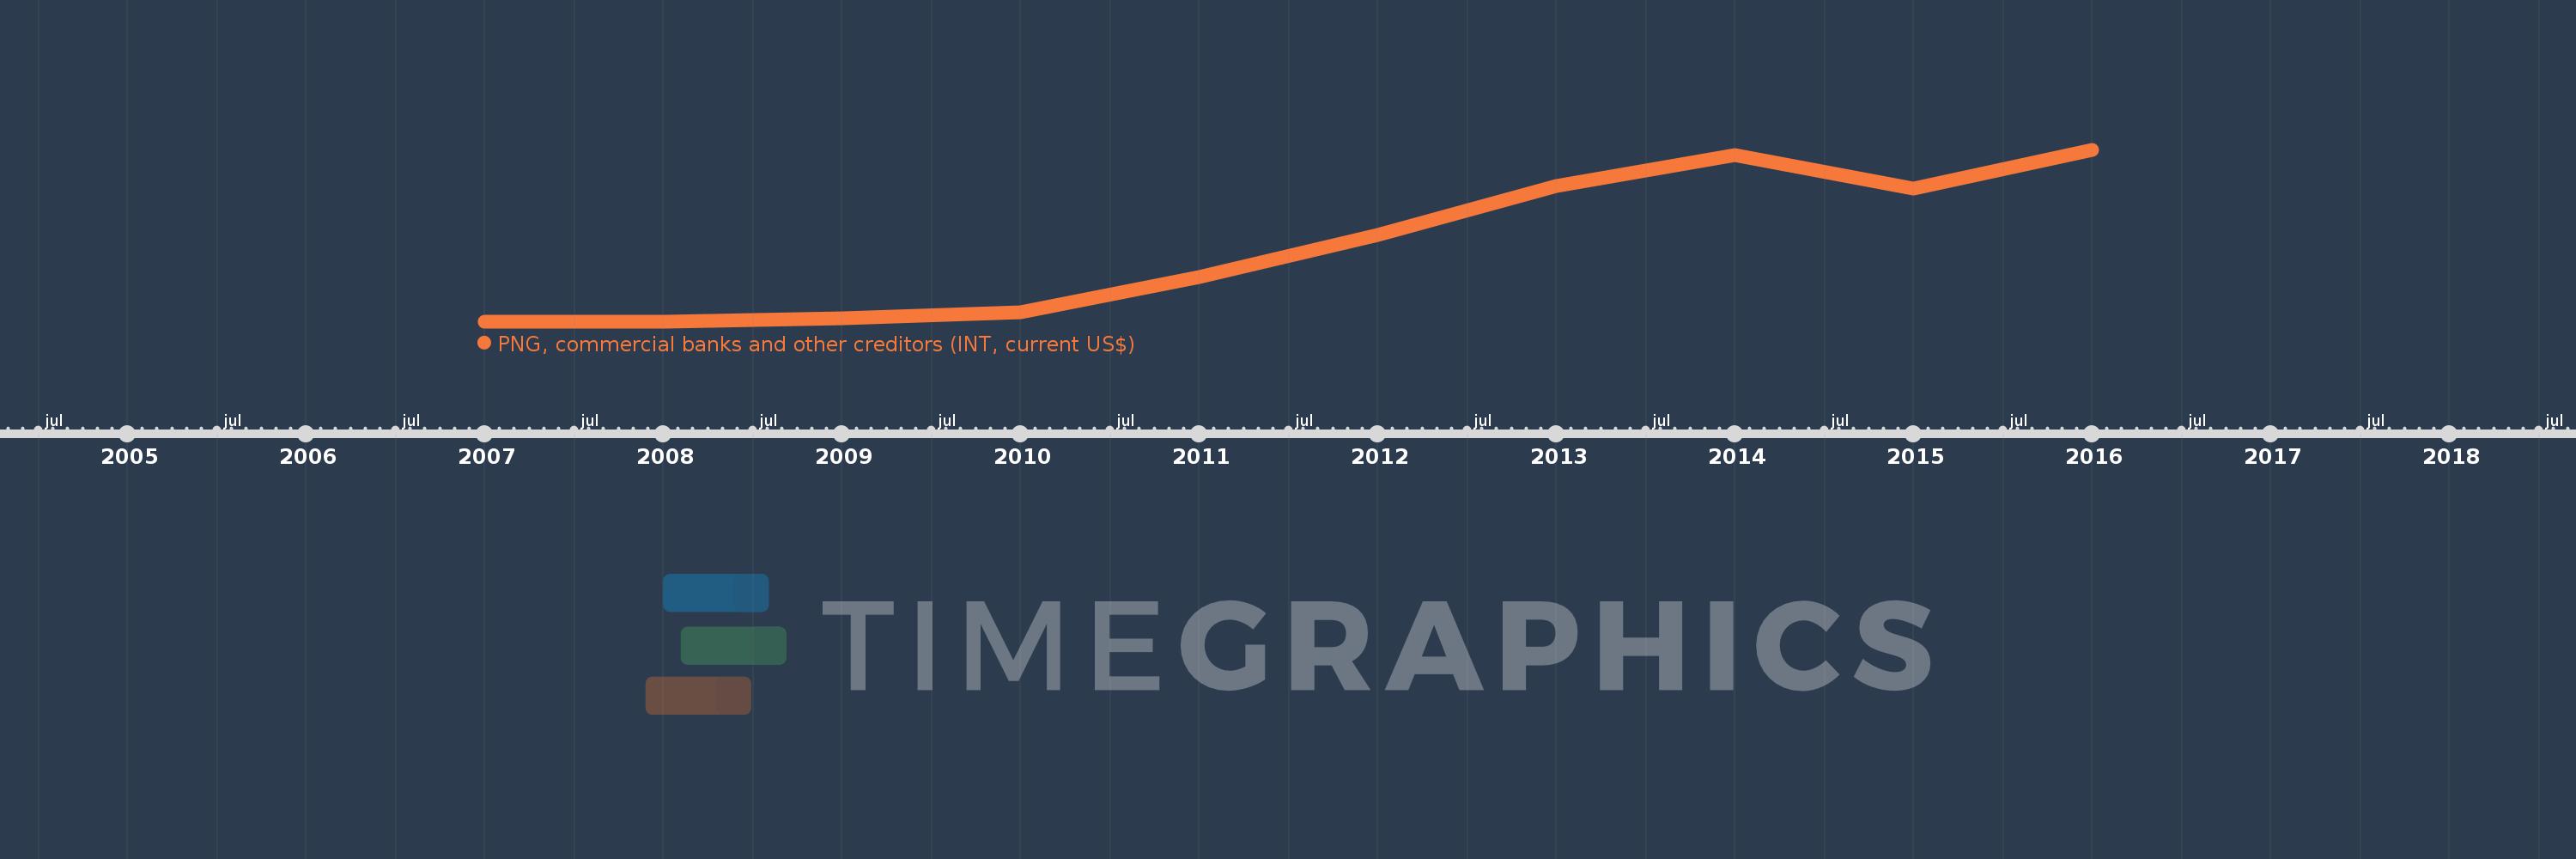
PNG, commercial banks and other creditors (INT, current US$)
2016,2015,2014,2013,2012,2011,2010,2009,2008,2007
This statistics in other country:
Timeline:
This timeline shows a graph from 2007 to 2016 of Mongolia. No data until 2006. Number of actual observations by date: 10.
Source name:
World Development Indicators
Source organization:
World Bank, International Debt Statistics.
Categories, topics:
External Debt
Last updated:
apr 23, 2017
Indicators value changes by year
Minimum:
114.0K
jan 1, 2007
Maximum:
265.301 mln
jan 1, 2016
At the date of observation
Value
Absolute change
Change from previous value
jan 1, 2007
114.0K
+114.0K
0.0%
jan 1, 2008
125.0K
+11.0K
9.65%
jan 1, 2009
5.872 mln
+5.747 mln
4.6K%
jan 1, 2010
15.397 mln
+9.525 mln
162.21%
jan 1, 2011
69.729 mln
+54.332 mln
352.87%
jan 1, 2012
134.358 mln
+64.629 mln
92.69%
jan 1, 2013
209.506 mln
+75.148 mln
55.93%
jan 1, 2014
257.841 mln
+48.335 mln
23.07%
jan 1, 2015
206.467 mln
-51.374 mln
-19.92%
jan 1, 2016
265.301 mln
+58.834 mln
28.5%
Ranking of countries by current statistics by years


Comments: