29
/
en
AIzaSyAYiBZKx7MnpbEhh9jyipgxe19OcubqV5w
April 1, 2024
78739
Bangladesh
BGD
true
2
1
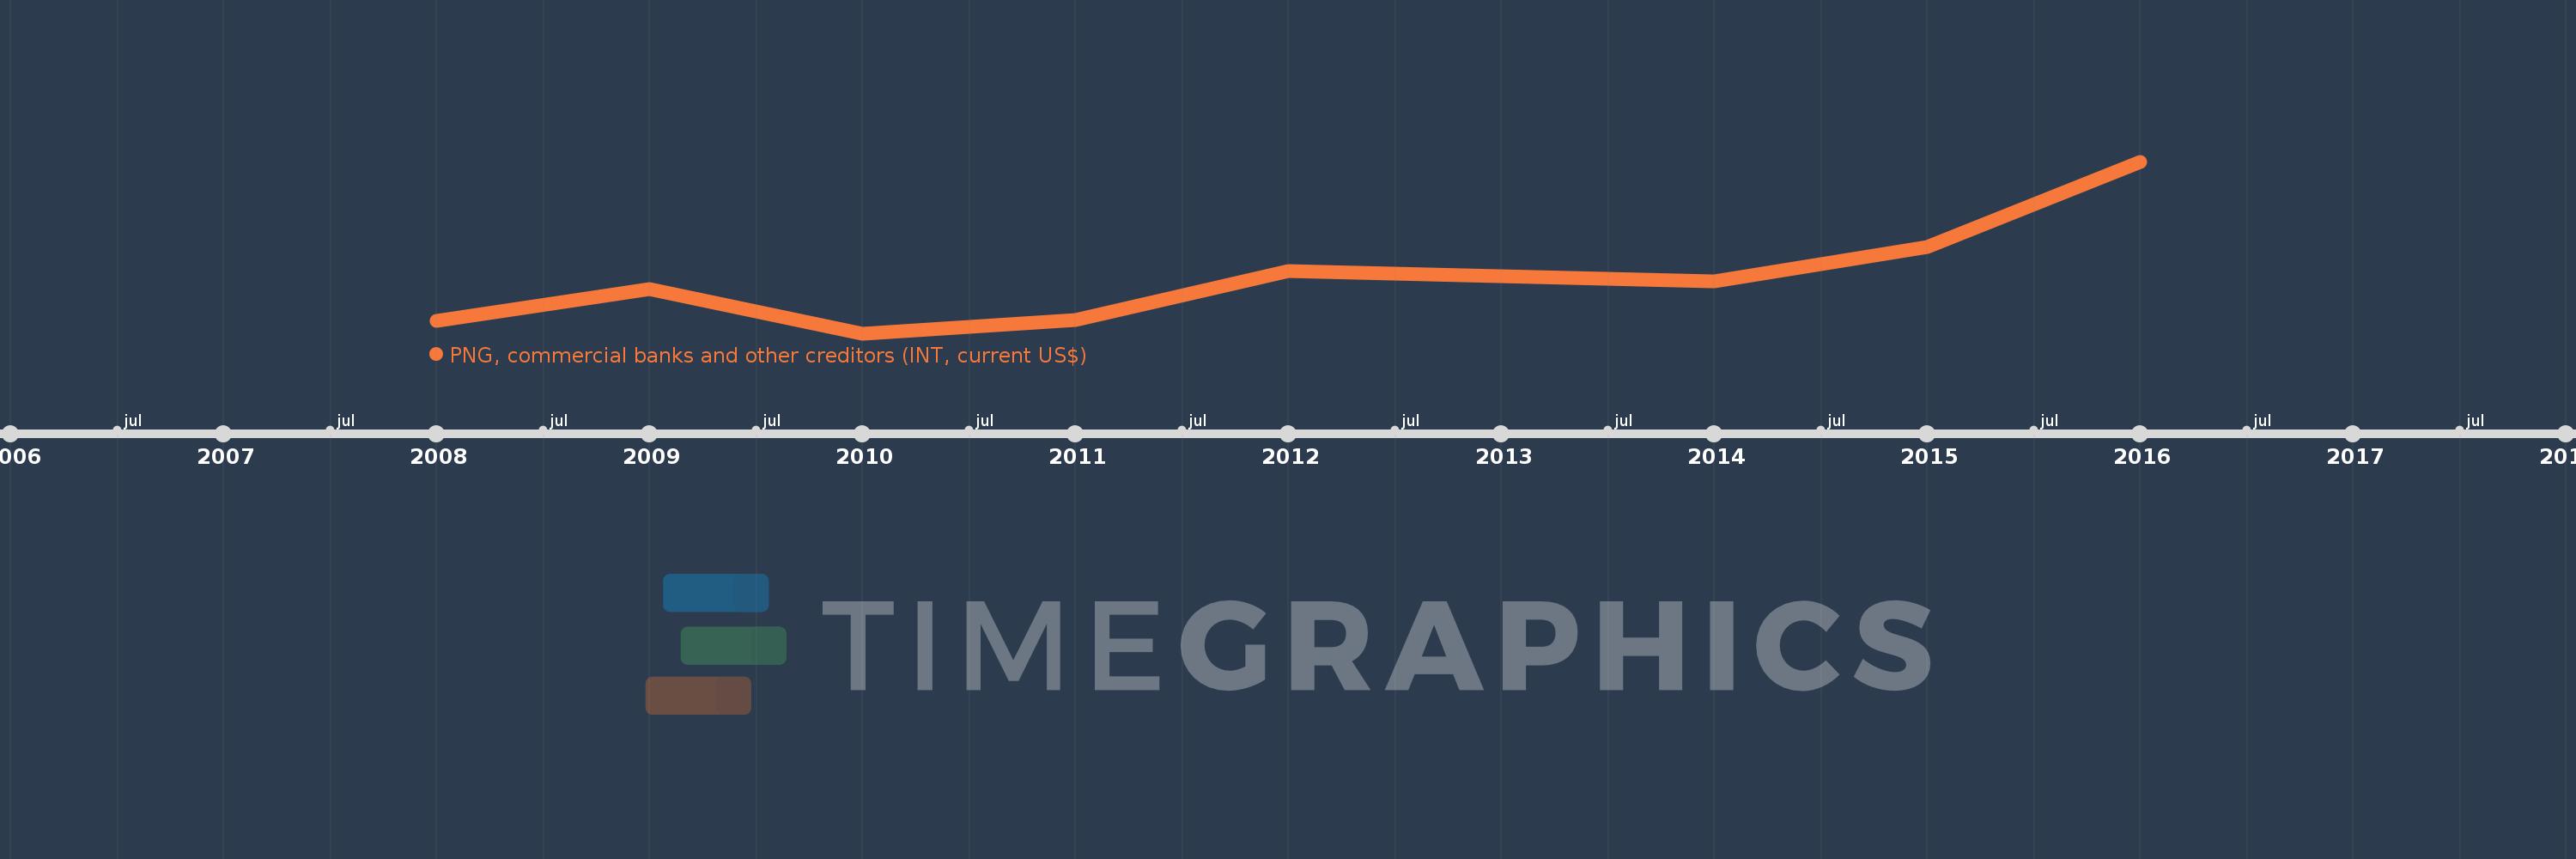
PNG, commercial banks and other creditors (INT, current US$)
2016,2015,2014,2013,2012,2011,2010,2009,2008
This statistics in other country:
Timeline:
This timeline shows a graph from 2008 to 2016 of Bangladesh. No data until 2007. Number of actual observations by date: 9.
Source name:
World Development Indicators
Source organization:
World Bank, International Debt Statistics.
Categories, topics:
External Debt
Last updated:
apr 23, 2017
Indicators value changes by year
Minimum:
5.796 mln
jan 1, 2010
Maximum:
29.97 mln
jan 1, 2016
At the date of observation
Value
Absolute change
Change from previous value
jan 1, 2008
7.503 mln
+7.503 mln
0.0%
jan 1, 2009
11.98 mln
+4.477 mln
59.67%
jan 1, 2010
5.796 mln
-6.184 mln
-51.62%
jan 1, 2011
7.65 mln
+1.854 mln
31.99%
jan 1, 2012
14.516 mln
+6.866 mln
89.75%
jan 1, 2013
13.884 mln
-632.0K
-4.35%
jan 1, 2014
13.075 mln
-809.0K
-5.83%
jan 1, 2015
17.912 mln
+4.837 mln
36.99%
jan 1, 2016
29.97 mln
+12.058 mln
67.32%
Ranking of countries by current statistics by years


Comments: