29
/
en
AIzaSyAYiBZKx7MnpbEhh9jyipgxe19OcubqV5w
April 1, 2024
199410
Mongolia
MNG
true
2
1
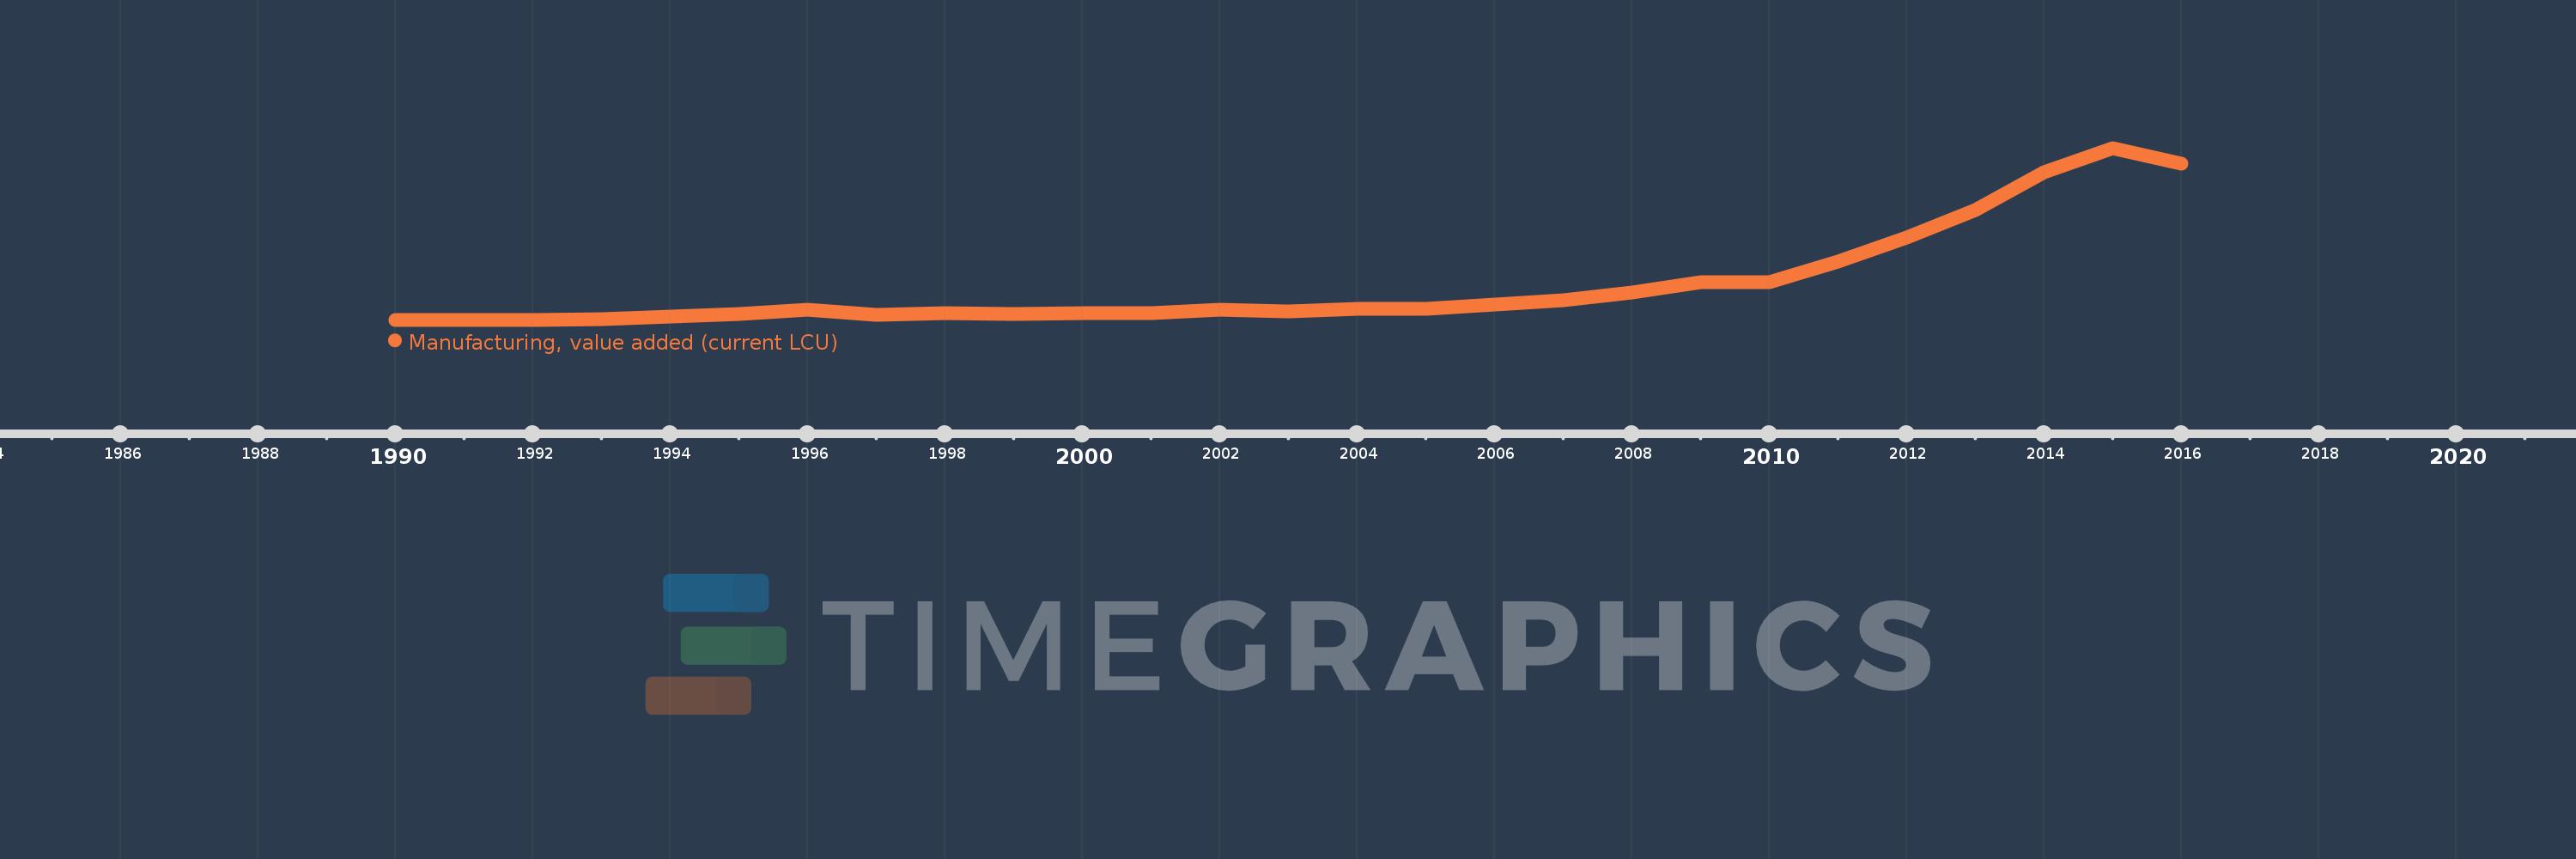
Manufacturing, value added (current LCU)
2016,2015,2014,2013,2012,2011,2010,2009,2008,2007,2006,2005,2004,2003,2002,2001,2000,1999,1998,1997,1996,1995,1994,1993,1992,1991,1990
This statistics in other country:
AfghanistanAlbaniaAlgeriaAndorraAngolaAntigua and BarbudaArgentinaArmeniaArubaAustraliaAustriaAzerbaijanBahamas, TheBahrainBangladeshBarbadosBelarusBelgiumBelizeBeninBermudaBhutanBoliviaBosnia and HerzegovinaBotswanaBrazilBrunei DarussalamBurkina FasoBurundiCabo VerdeCambodiaCameroonCanadaCayman IslandsCentral African RepublicChadChileChinaColombiaComorosCongo, Dem. Rep.Congo, Rep.Costa RicaCote d'IvoireCroatiaCubaCyprusCzech RepublicDenmarkDjiboutiDominicaDominican RepublicEcuadorEgypt, Arab Rep.El SalvadorEquatorial GuineaEritreaEstoniaEthiopiaFaroe IslandsFijiFinlandFranceGabonGambia, TheGeorgiaGermanyGhanaGreeceGrenadaGuatemalaGuineaGuinea-BissauGuyanaHondurasHong Kong SAR, ChinaHungaryIcelandIndiaIndonesiaIran, Islamic Rep.IraqIrelandItalyJamaicaJapanJordanKazakhstanKenyaKiribatiKorea, Rep.KosovoKuwaitKyrgyz RepublicLao PDRLatviaLebanonLesothoLiberiaLibyaLithuaniaLuxembourgMacao SAR, ChinaMacedonia, FYRMadagascarMalawiMalaysiaMaldivesMaliMaltaMarshall IslandsMauritaniaMauritiusMexicoMicronesia, Fed. Sts.MoldovaMongoliaMontenegroMoroccoMozambiqueMyanmarNamibiaNepalNetherlandsNew CaledoniaNew ZealandNicaraguaNigerNigeriaNorwayOmanPakistanPalauPanamaPapua New GuineaParaguayPeruPhilippinesPolandPortugalPuerto RicoQatarRomaniaRussian FederationRwandaSamoaSao Tome and PrincipeSaudi ArabiaSenegalSerbiaSeychellesSierra LeoneSingaporeSlovak RepublicSloveniaSolomon IslandsSomaliaSouth AfricaSpainSri LankaSt. Kitts and NevisSt. LuciaSt. Vincent and the GrenadinesSudanSurinameSwazilandSwedenSwitzerlandSyrian Arab RepublicTajikistanTanzaniaThailandTimor-LesteTogoTongaTrinidad and TobagoTunisiaTurkeyTurkmenistanTuvaluUgandaUkraineUnited Arab EmiratesUnited KingdomUnited StatesUruguayUzbekistanVanuatuVenezuela, RBVietnamWest Bank and GazaYemen, Rep.ZambiaZimbabwe Timeline:
This timeline shows a graph from 1990 to 2016 of Mongolia. No data until 1989. Number of actual observations by date: 27.
Source name:
World Development Indicators
Source organization:
World Bank national accounts data, and OECD National Accounts data files.
Categories, topics:
Economy & Growth
Last updated:
apr 23, 2017
Indicators value changes by year
Minimum:
2.608 bln
jan 1, 1991
Maximum:
1.951 trl
jan 1, 2015
At the date of observation
Value
Absolute change
Change from previous value
jan 1, 1990
3.509 bln
+3.509 bln
0.0%
jan 1, 1991
2.608 bln
-901.209 mln
-25.68%
jan 1, 1992
3.835 bln
+1.227 bln
47.03%
jan 1, 1993
10.436 bln
+6.601 bln
172.14%
jan 1, 1994
37.075 bln
+26.64 bln
255.28%
jan 1, 1995
64.104 bln
+27.028 bln
72.9%
jan 1, 1996
112.581 bln
+48.477 bln
75.62%
jan 1, 1997
56.654 bln
-55.927 bln
-49.68%
jan 1, 1998
78.9 bln
+22.246 bln
39.27%
jan 1, 1999
66.93 bln
-11.97 bln
-15.17%
jan 1, 2000
75.926 bln
+8.996 bln
13.44%
jan 1, 2001
82.041 bln
+6.115 bln
8.05%
jan 1, 2002
114.828 bln
+32.787 bln
39.96%
jan 1, 2003
99.139 bln
-15.69 bln
-13.66%
jan 1, 2004
121.551 bln
+22.413 bln
22.61%
jan 1, 2005
130.576 bln
+9.025 bln
7.42%
jan 1, 2006
175.156 bln
+44.58 bln
34.14%
jan 1, 2007
218.886 bln
+43.73 bln
24.97%
jan 1, 2008
309.5 bln
+90.615 bln
41.4%
jan 1, 2009
430.179 bln
+120.679 bln
38.99%
jan 1, 2010
425.001 bln
-5.179 bln
-1.2%
jan 1, 2011
664.815 bln
+239.815 bln
56.43%
jan 1, 2012
931.378 bln
+266.562 bln
40.1%
jan 1, 2013
1.249 trl
+317.289 bln
34.07%
jan 1, 2014
1.672 trl
+423.647 bln
33.93%
jan 1, 2015
1.951 trl
+278.621 bln
16.66%
jan 1, 2016
1.768 trl
-182.712 bln
-9.37%
Ranking of countries by current statistics by years


Comments: