29
/
en
AIzaSyAYiBZKx7MnpbEhh9jyipgxe19OcubqV5w
April 1, 2024
130723
Ethiopia
ETH
true
2
1
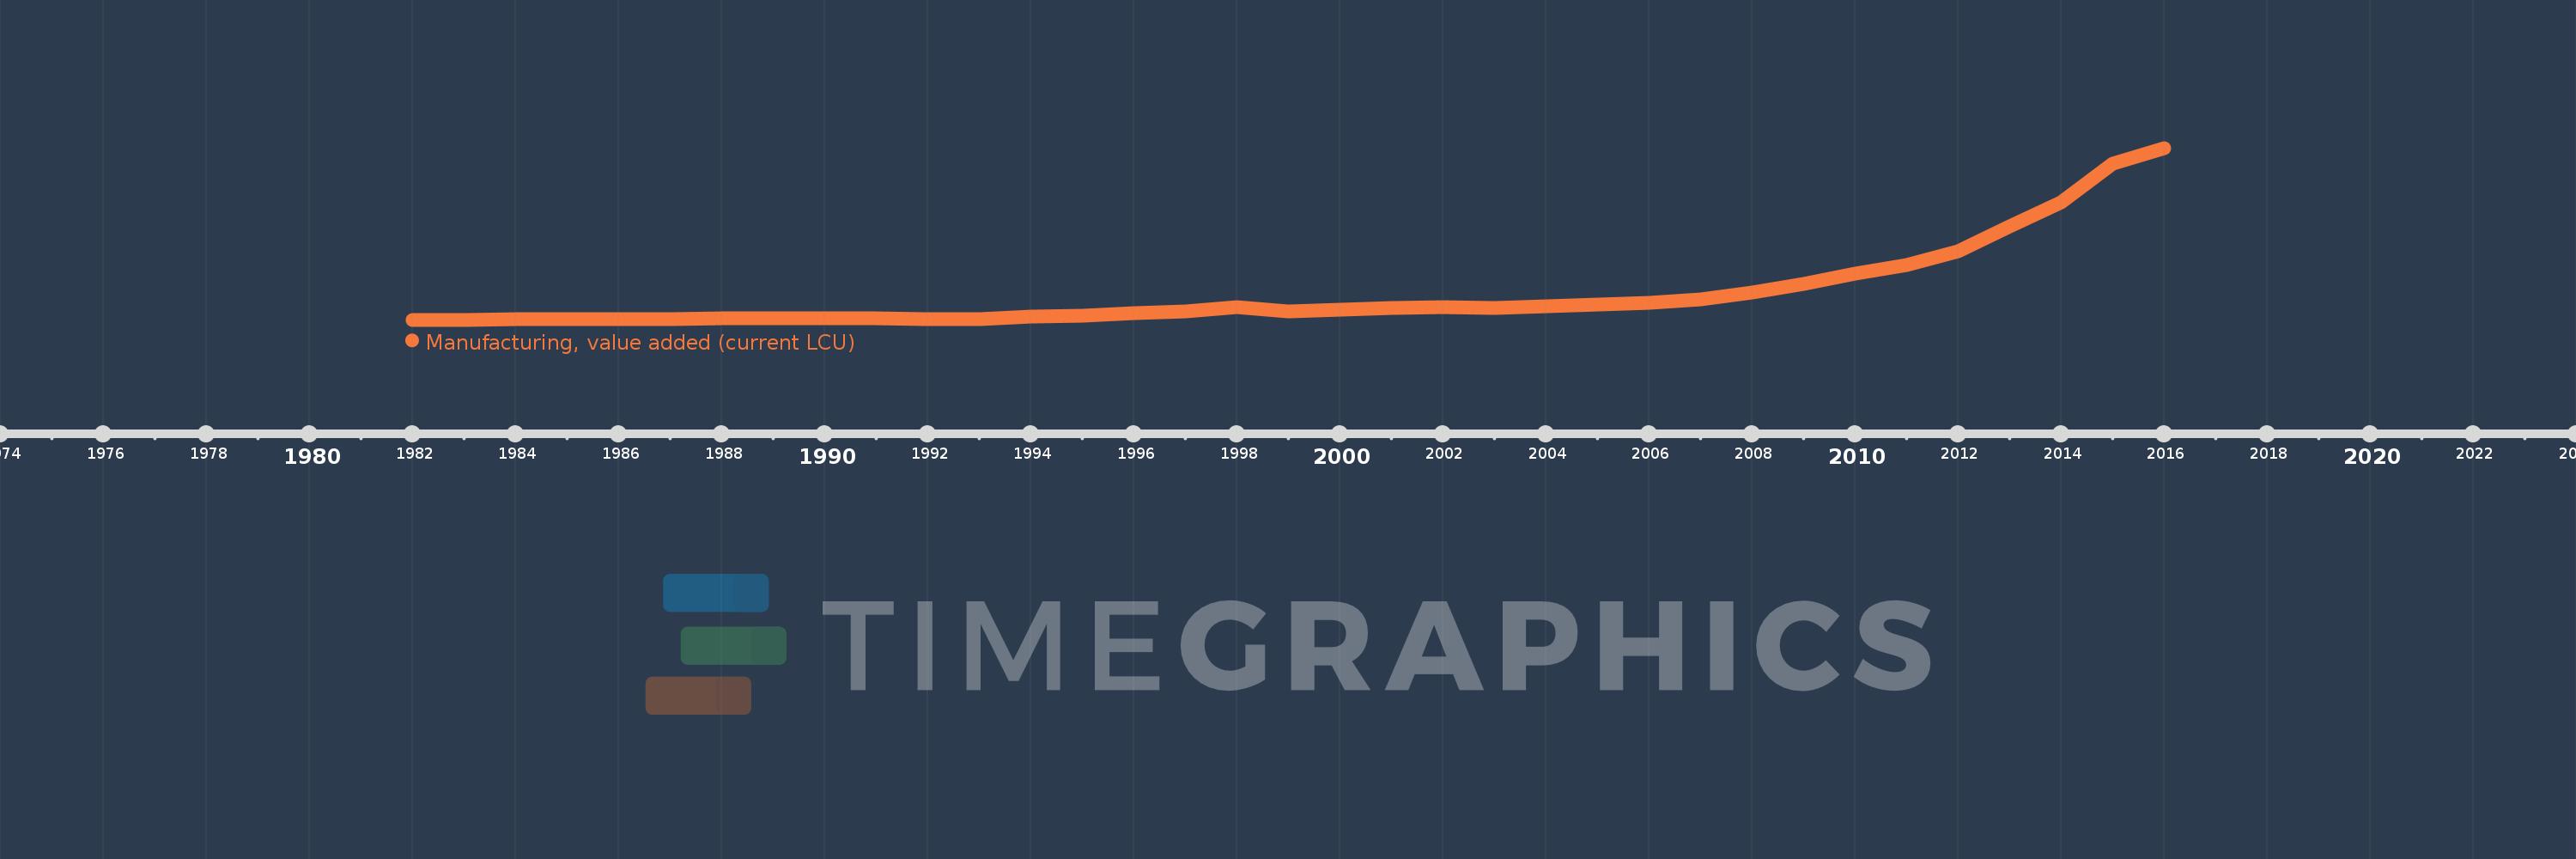
Manufacturing, value added (current LCU)
2016,2015,2014,2013,2012,2011,2010,2009,2008,2007,2006,2005,2004,2003,2002,2001,2000,1999,1998,1997,1996,1995,1994,1993,1992,1991,1990,1989,1988,1987,1986,1985,1984,1983,1982
This statistics in other country:
AfghanistanAlbaniaAlgeriaAndorraAngolaAntigua and BarbudaArgentinaArmeniaArubaAustraliaAustriaAzerbaijanBahamas, TheBahrainBangladeshBarbadosBelarusBelgiumBelizeBeninBermudaBhutanBoliviaBosnia and HerzegovinaBotswanaBrazilBrunei DarussalamBurkina FasoBurundiCabo VerdeCambodiaCameroonCanadaCayman IslandsCentral African RepublicChadChileChinaColombiaComorosCongo, Dem. Rep.Congo, Rep.Costa RicaCote d'IvoireCroatiaCubaCyprusCzech RepublicDenmarkDjiboutiDominicaDominican RepublicEcuadorEgypt, Arab Rep.El SalvadorEquatorial GuineaEritreaEstoniaEthiopiaFaroe IslandsFijiFinlandFranceGabonGambia, TheGeorgiaGermanyGhanaGreeceGrenadaGuatemalaGuineaGuinea-BissauGuyanaHondurasHong Kong SAR, ChinaHungaryIcelandIndiaIndonesiaIran, Islamic Rep.IraqIrelandItalyJamaicaJapanJordanKazakhstanKenyaKiribatiKorea, Rep.KosovoKuwaitKyrgyz RepublicLao PDRLatviaLebanonLesothoLiberiaLibyaLithuaniaLuxembourgMacao SAR, ChinaMacedonia, FYRMadagascarMalawiMalaysiaMaldivesMaliMaltaMarshall IslandsMauritaniaMauritiusMexicoMicronesia, Fed. Sts.MoldovaMongoliaMontenegroMoroccoMozambiqueMyanmarNamibiaNepalNetherlandsNew CaledoniaNew ZealandNicaraguaNigerNigeriaNorwayOmanPakistanPalauPanamaPapua New GuineaParaguayPeruPhilippinesPolandPortugalPuerto RicoQatarRomaniaRussian FederationRwandaSamoaSao Tome and PrincipeSaudi ArabiaSenegalSerbiaSeychellesSierra LeoneSingaporeSlovak RepublicSloveniaSolomon IslandsSomaliaSouth AfricaSpainSri LankaSt. Kitts and NevisSt. LuciaSt. Vincent and the GrenadinesSudanSurinameSwazilandSwedenSwitzerlandSyrian Arab RepublicTajikistanTanzaniaThailandTimor-LesteTogoTongaTrinidad and TobagoTunisiaTurkeyTurkmenistanTuvaluUgandaUkraineUnited Arab EmiratesUnited KingdomUnited StatesUruguayUzbekistanVanuatuVenezuela, RBVietnamWest Bank and GazaYemen, Rep.ZambiaZimbabwe Timeline:
This timeline shows a graph from 1982 to 2016 of Ethiopia. No data until 1981. Number of actual observations by date: 35.
Source name:
World Development Indicators
Source organization:
World Bank national accounts data, and OECD National Accounts data files.
Categories, topics:
Economy & Growth
Last updated:
apr 23, 2017
Indicators value changes by year
Minimum:
666.431 mln
jan 1, 1982
Maximum:
46.619 bln
jan 1, 2016
At the date of observation
Value
Absolute change
Change from previous value
jan 1, 1982
666.431 mln
+666.431 mln
0.0%
jan 1, 1983
681.117 mln
+14.686 mln
2.2%
jan 1, 1984
732.4 mln
+51.283 mln
7.53%
jan 1, 1985
829.437 mln
+97.037 mln
13.25%
jan 1, 1986
796.776 mln
-32.66 mln
-3.94%
jan 1, 1987
896.41 mln
+99.634 mln
12.5%
jan 1, 1988
1.121 bln
+225.0 mln
25.1%
jan 1, 1989
1.1 bln
-21.314 mln
-1.9%
jan 1, 1990
1.148 bln
+48.157 mln
4.38%
jan 1, 1991
1.166 bln
+17.413 mln
1.52%
jan 1, 1992
897.703 mln
-267.963 mln
-22.99%
jan 1, 1993
915.578 mln
+17.875 mln
1.99%
jan 1, 1994
1.489 bln
+573.024 mln
62.59%
jan 1, 1995
1.712 bln
+223.684 mln
15.03%
jan 1, 1996
2.342 bln
+629.365 mln
36.76%
jan 1, 1997
2.815 bln
+473.467 mln
20.22%
jan 1, 1998
4.075 bln
+1.26 bln
44.76%
jan 1, 1999
2.828 bln
-1.247 bln
-30.59%
jan 1, 2000
3.316 bln
+487.964 mln
17.25%
jan 1, 2001
3.764 bln
+448.047 mln
13.51%
jan 1, 2002
3.96 bln
+195.064 mln
5.18%
jan 1, 2003
3.867 bln
-92.119 mln
-2.33%
jan 1, 2004
4.27 bln
+402.154 mln
10.4%
jan 1, 2005
4.673 bln
+402.972 mln
9.44%
jan 1, 2006
5.196 bln
+523.454 mln
11.2%
jan 1, 2007
6.152 bln
+956.037 mln
18.4%
jan 1, 2008
7.937 bln
+1.785 bln
29.01%
jan 1, 2009
10.279 bln
+2.342 bln
29.51%
jan 1, 2010
13.114 bln
+2.835 bln
27.58%
jan 1, 2011
15.334 bln
+2.22 bln
16.93%
jan 1, 2012
18.968 bln
+3.634 bln
23.7%
jan 1, 2013
25.559 bln
+6.591 bln
34.75%
jan 1, 2014
32.095 bln
+6.536 bln
25.57%
jan 1, 2015
42.341 bln
+10.245 bln
31.92%
jan 1, 2016
46.619 bln
+4.279 bln
10.11%
Ranking of countries by current statistics by years


Comments: