29
/
en
AIzaSyAYiBZKx7MnpbEhh9jyipgxe19OcubqV5w
April 1, 2024
195971
Mexico
MEX
true
2
1
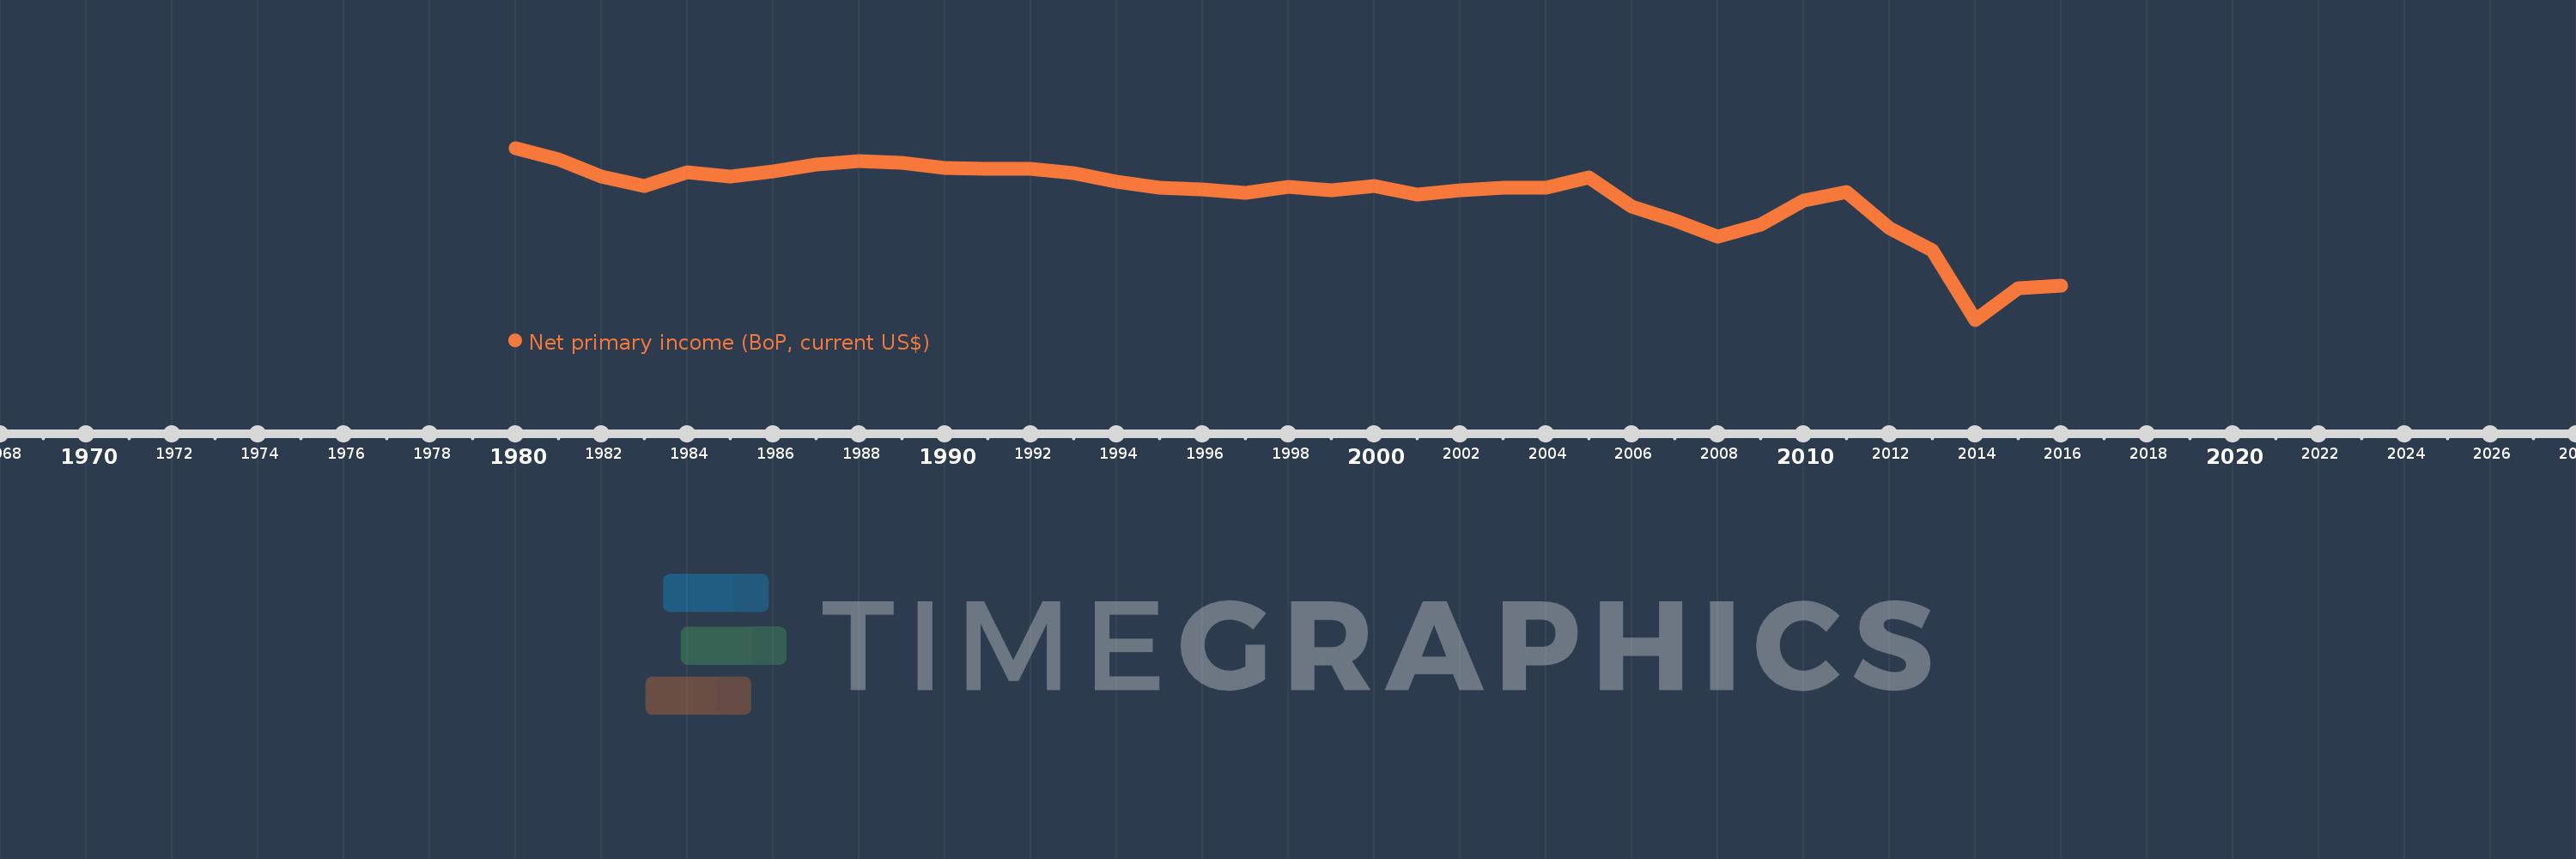
Net primary income (BoP, current US$)
2016,2015,2014,2013,2012,2011,2010,2009,2008,2007,2006,2005,2004,2003,2002,2001,2000,1999,1998,1997,1996,1995,1994,1993,1992,1991,1990,1989,1988,1987,1986,1985,1984,1983,1982,1981,1980
This statistics in other country:
AfghanistanAlbaniaAlgeriaAngolaAntigua and BarbudaArgentinaArmeniaArubaAustraliaAustriaAzerbaijanBahamas, TheBahrainBangladeshBarbadosBelarusBelgiumBelizeBeninBermudaBhutanBoliviaBosnia and HerzegovinaBotswanaBrazilBrunei DarussalamBulgariaBurkina FasoBurundiCabo VerdeCambodiaCameroonCanadaCentral African RepublicChadChileChinaColombiaComorosCongo, Dem. Rep.Congo, Rep.Costa RicaCote d'IvoireCroatiaCuracaoCyprusCzech RepublicDenmarkDjiboutiDominicaDominican RepublicEcuadorEgypt, Arab Rep.El SalvadorEquatorial GuineaEritreaEstoniaEthiopiaEuro areaFaroe IslandsFijiFinlandFranceFrench PolynesiaGabonGambia, TheGeorgiaGermanyGhanaGreeceGrenadaGuatemalaGuineaGuinea-BissauGuyanaHaitiHondurasHong Kong SAR, ChinaHungaryIcelandIndiaIndonesiaIran, Islamic Rep.IraqIrelandIsraelItalyJamaicaJapanJordanKazakhstanKenyaKiribatiKorea, Rep.KosovoKuwaitKyrgyz RepublicLao PDRLatviaLebanonLesothoLiberiaLibyaLithuaniaLuxembourgMacao SAR, ChinaMacedonia, FYRMadagascarMalawiMalaysiaMaldivesMaliMaltaMarshall IslandsMauritaniaMauritiusMexicoMicronesia, Fed. Sts.MoldovaMongoliaMontenegroMoroccoMozambiqueMyanmarNamibiaNepalNetherlandsNew CaledoniaNew ZealandNicaraguaNigerNigeriaNorwayOmanPakistanPalauPanamaPapua New GuineaParaguayPeruPhilippinesPolandPortugalQatarRomaniaRussian FederationRwandaSamoaSao Tome and PrincipeSaudi ArabiaSenegalSerbiaSeychellesSierra LeoneSingaporeSint Maarten (Dutch part)Slovak RepublicSloveniaSolomon IslandsSouth AfricaSouth SudanSpainSri LankaSt. Kitts and NevisSt. LuciaSt. Vincent and the GrenadinesSudanSurinameSwazilandSwedenSwitzerlandSyrian Arab RepublicTajikistanTanzaniaThailandTimor-LesteTogoTongaTrinidad and TobagoTunisiaTurkeyTuvaluUgandaUkraineUnited KingdomUnited StatesUruguayVanuatuVenezuela, RBVietnamWest Bank and GazaYemen, Rep.ZambiaZimbabwe Timeline:
This timeline shows a graph from 1980 to 2016 of Mexico. No data until 1979. Number of actual observations by date: 37.
Source name:
World Development Indicators
Source organization:
International Monetary Fund, Balance of Payments Statistics Yearbook and data files.
Categories, topics:
Economy & Growth
Last updated:
apr 23, 2017
Indicators value changes by year
Minimum:
-40.739 bln
jan 1, 2014
Maximum:
-3.783 bln
jan 1, 1980
At the date of observation
Value
Absolute change
Change from previous value
jan 1, 1980
-3.783 bln
-3.783 bln
0.0%
jan 1, 1981
-6.277 bln
-2.494 bln
65.93%
jan 1, 1982
-9.875 bln
-3.598 bln
57.32%
jan 1, 1983
-12.049 bln
-2.174 bln
22.02%
jan 1, 1984
-9.024 bln
+3.025 bln
-25.11%
jan 1, 1985
-9.967 bln
-943.0 mln
10.45%
jan 1, 1986
-8.867 bln
+1.1 bln
-11.04%
jan 1, 1987
-7.367 bln
+1.5 bln
-16.92%
jan 1, 1988
-6.585 bln
+782.0 mln
-10.61%
jan 1, 1989
-7.043 bln
-458.0 mln
6.96%
jan 1, 1990
-8.101 bln
-1.058 bln
15.02%
jan 1, 1991
-8.316 bln
-215.0 mln
2.65%
jan 1, 1992
-8.265 bln
+51.0 mln
-0.61%
jan 1, 1993
-9.209 bln
-944.0 mln
11.42%
jan 1, 1994
-11.03 bln
-1.821 bln
19.77%
jan 1, 1995
-12.259 bln
-1.229 bln
11.14%
jan 1, 1996
-12.689 bln
-430.28 mln
3.51%
jan 1, 1997
-13.475 bln
-786.042 mln
6.19%
jan 1, 1998
-12.106 bln
+1.369 bln
-10.16%
jan 1, 1999
-12.824 bln
-718.688 mln
5.94%
jan 1, 2000
-11.962 bln
+861.926 mln
-6.72%
jan 1, 2001
-13.805 bln
-1.842 bln
15.4%
jan 1, 2002
-12.981 bln
+823.483 mln
-5.97%
jan 1, 2003
-12.247 bln
+734.457 mln
-5.66%
jan 1, 2004
-12.293 bln
-46.267 mln
0.38%
jan 1, 2005
-10.095 bln
+2.198 bln
-17.88%
jan 1, 2006
-16.46 bln
-6.365 bln
63.05%
jan 1, 2007
-19.413 bln
-2.953 bln
17.94%
jan 1, 2008
-22.942 bln
-3.529 bln
18.18%
jan 1, 2009
-20.252 bln
+2.69 bln
-11.72%
jan 1, 2010
-15.174 bln
+5.078 bln
-25.07%
jan 1, 2011
-13.256 bln
+1.918 bln
-12.64%
jan 1, 2012
-20.96 bln
-7.704 bln
58.11%
jan 1, 2013
-25.802 bln
-4.842 bln
23.1%
jan 1, 2014
-40.739 bln
-14.937 bln
57.89%
jan 1, 2015
-33.922 bln
+6.817 bln
-16.73%
jan 1, 2016
-33.314 bln
+608.503 mln
-1.79%
Ranking of countries by current statistics by years


Comments: