29
/
en
AIzaSyAYiBZKx7MnpbEhh9jyipgxe19OcubqV5w
April 1, 2024
262674
Thailand
THA
true
2
1
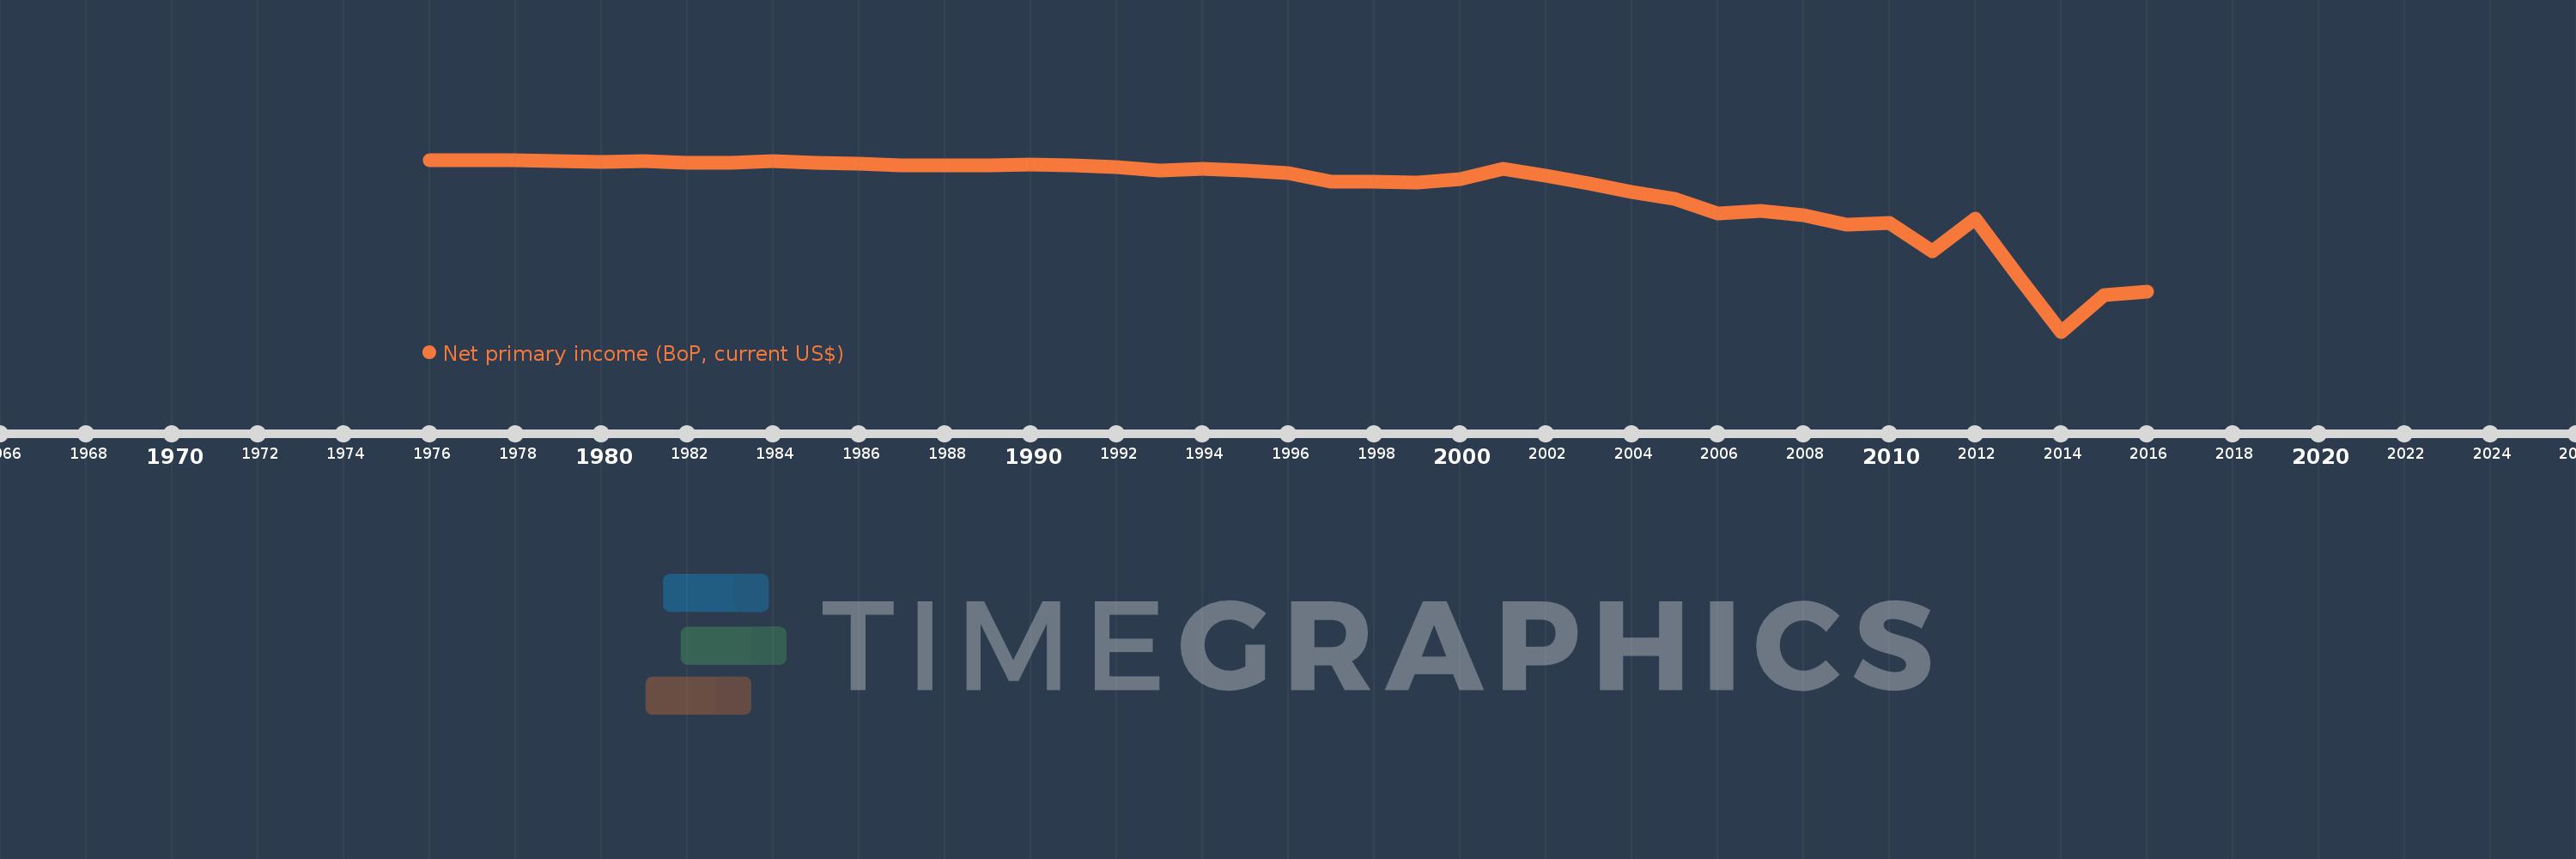
Net primary income (BoP, current US$)
2016,2015,2014,2013,2012,2011,2010,2009,2008,2007,2006,2005,2004,2003,2002,2001,2000,1999,1998,1997,1996,1995,1994,1993,1992,1991,1990,1989,1988,1987,1986,1985,1984,1983,1982,1981,1980,1979,1978,1977,1976
This statistics in other country:
AfghanistanAlbaniaAlgeriaAngolaAntigua and BarbudaArgentinaArmeniaArubaAustraliaAustriaAzerbaijanBahamas, TheBahrainBangladeshBarbadosBelarusBelgiumBelizeBeninBermudaBhutanBoliviaBosnia and HerzegovinaBotswanaBrazilBrunei DarussalamBulgariaBurkina FasoBurundiCabo VerdeCambodiaCameroonCanadaCentral African RepublicChadChileChinaColombiaComorosCongo, Dem. Rep.Congo, Rep.Costa RicaCote d'IvoireCroatiaCuracaoCyprusCzech RepublicDenmarkDjiboutiDominicaDominican RepublicEcuadorEgypt, Arab Rep.El SalvadorEquatorial GuineaEritreaEstoniaEthiopiaEuro areaFaroe IslandsFijiFinlandFranceFrench PolynesiaGabonGambia, TheGeorgiaGermanyGhanaGreeceGrenadaGuatemalaGuineaGuinea-BissauGuyanaHaitiHondurasHong Kong SAR, ChinaHungaryIcelandIndiaIndonesiaIran, Islamic Rep.IraqIrelandIsraelItalyJamaicaJapanJordanKazakhstanKenyaKiribatiKorea, Rep.KosovoKuwaitKyrgyz RepublicLao PDRLatviaLebanonLesothoLiberiaLibyaLithuaniaLuxembourgMacao SAR, ChinaMacedonia, FYRMadagascarMalawiMalaysiaMaldivesMaliMaltaMarshall IslandsMauritaniaMauritiusMexicoMicronesia, Fed. Sts.MoldovaMongoliaMontenegroMoroccoMozambiqueMyanmarNamibiaNepalNetherlandsNew CaledoniaNew ZealandNicaraguaNigerNigeriaNorwayOmanPakistanPalauPanamaPapua New GuineaParaguayPeruPhilippinesPolandPortugalQatarRomaniaRussian FederationRwandaSamoaSao Tome and PrincipeSaudi ArabiaSenegalSerbiaSeychellesSierra LeoneSingaporeSint Maarten (Dutch part)Slovak RepublicSloveniaSolomon IslandsSouth AfricaSouth SudanSpainSri LankaSt. Kitts and NevisSt. LuciaSt. Vincent and the GrenadinesSudanSurinameSwazilandSwedenSwitzerlandSyrian Arab RepublicTajikistanTanzaniaThailandTimor-LesteTogoTongaTrinidad and TobagoTunisiaTurkeyTuvaluUgandaUkraineUnited KingdomUnited StatesUruguayVanuatuVenezuela, RBVietnamWest Bank and GazaYemen, Rep.ZambiaZimbabwe Timeline:
This timeline shows a graph from 1976 to 2016 of Thailand. No data until 1975. Number of actual observations by date: 41.
Source name:
World Development Indicators
Source organization:
International Monetary Fund, Balance of Payments Statistics Yearbook and data files.
Categories, topics:
Economy & Growth
Last updated:
apr 23, 2017
Indicators value changes by year
Minimum:
-26.901 bln
jan 1, 2014
Maximum:
10.992 mln
jan 1, 1976
At the date of observation
Value
Absolute change
Change from previous value
jan 1, 1976
10.992 mln
+10.992 mln
0.0%
jan 1, 1977
-53.676 mln
-64.668 mln
-588.34%
jan 1, 1978
-38.137 mln
+15.539 mln
-28.95%
jan 1, 1979
-148.224 mln
-110.087 mln
288.66%
jan 1, 1980
-277.865 mln
-129.641 mln
87.46%
jan 1, 1981
-229.306 mln
+48.559 mln
-17.48%
jan 1, 1982
-502.425 mln
-273.119 mln
119.11%
jan 1, 1983
-514.563 mln
-12.137 mln
2.42%
jan 1, 1984
-227.086 mln
+287.477 mln
-55.87%
jan 1, 1985
-440.24 mln
-213.154 mln
93.87%
jan 1, 1986
-597.13 mln
-156.889 mln
35.64%
jan 1, 1987
-816.71 mln
-219.58 mln
36.77%
jan 1, 1988
-829.672 mln
-12.962 mln
1.59%
jan 1, 1989
-894.373 mln
-64.701 mln
7.8%
jan 1, 1990
-780.518 mln
+113.855 mln
-12.73%
jan 1, 1991
-853.388 mln
-72.869 mln
9.34%
jan 1, 1992
-1.075 bln
-222.005 mln
26.01%
jan 1, 1993
-1.708 bln
-632.331 mln
58.8%
jan 1, 1994
-1.406 bln
+301.477 mln
-17.65%
jan 1, 1995
-1.731 bln
-324.551 mln
23.08%
jan 1, 1996
-2.114 bln
-382.831 mln
22.12%
jan 1, 1997
-3.385 bln
-1.272 bln
60.17%
jan 1, 1998
-3.48 bln
-94.905 mln
2.8%
jan 1, 1999
-3.567 bln
-86.899 mln
2.5%
jan 1, 2000
-2.991 bln
+576.18 mln
-16.15%
jan 1, 2001
-1.381 bln
+1.61 bln
-53.82%
jan 1, 2002
-2.457 bln
-1.076 bln
77.89%
jan 1, 2003
-3.663 bln
-1.206 bln
49.09%
jan 1, 2004
-4.973 bln
-1.31 bln
35.76%
jan 1, 2005
-6.12 bln
-1.147 bln
23.07%
jan 1, 2006
-8.371 bln
-2.251 bln
36.77%
jan 1, 2007
-8.046 bln
+324.99 mln
-3.88%
jan 1, 2008
-8.693 bln
-647.19 mln
8.04%
jan 1, 2009
-10.194 bln
-1.501 bln
17.27%
jan 1, 2010
-9.927 bln
+267.699 mln
-2.63%
jan 1, 2011
-14.314 bln
-4.388 bln
44.2%
jan 1, 2012
-9.14 bln
+5.175 bln
-36.15%
jan 1, 2013
-18.241 bln
-9.101 bln
99.58%
jan 1, 2014
-26.901 bln
-8.66 bln
47.47%
jan 1, 2015
-21.18 bln
+5.721 bln
-21.27%
jan 1, 2016
-20.623 bln
+557.289 mln
-2.63%
Ranking of countries by current statistics by years


Comments: