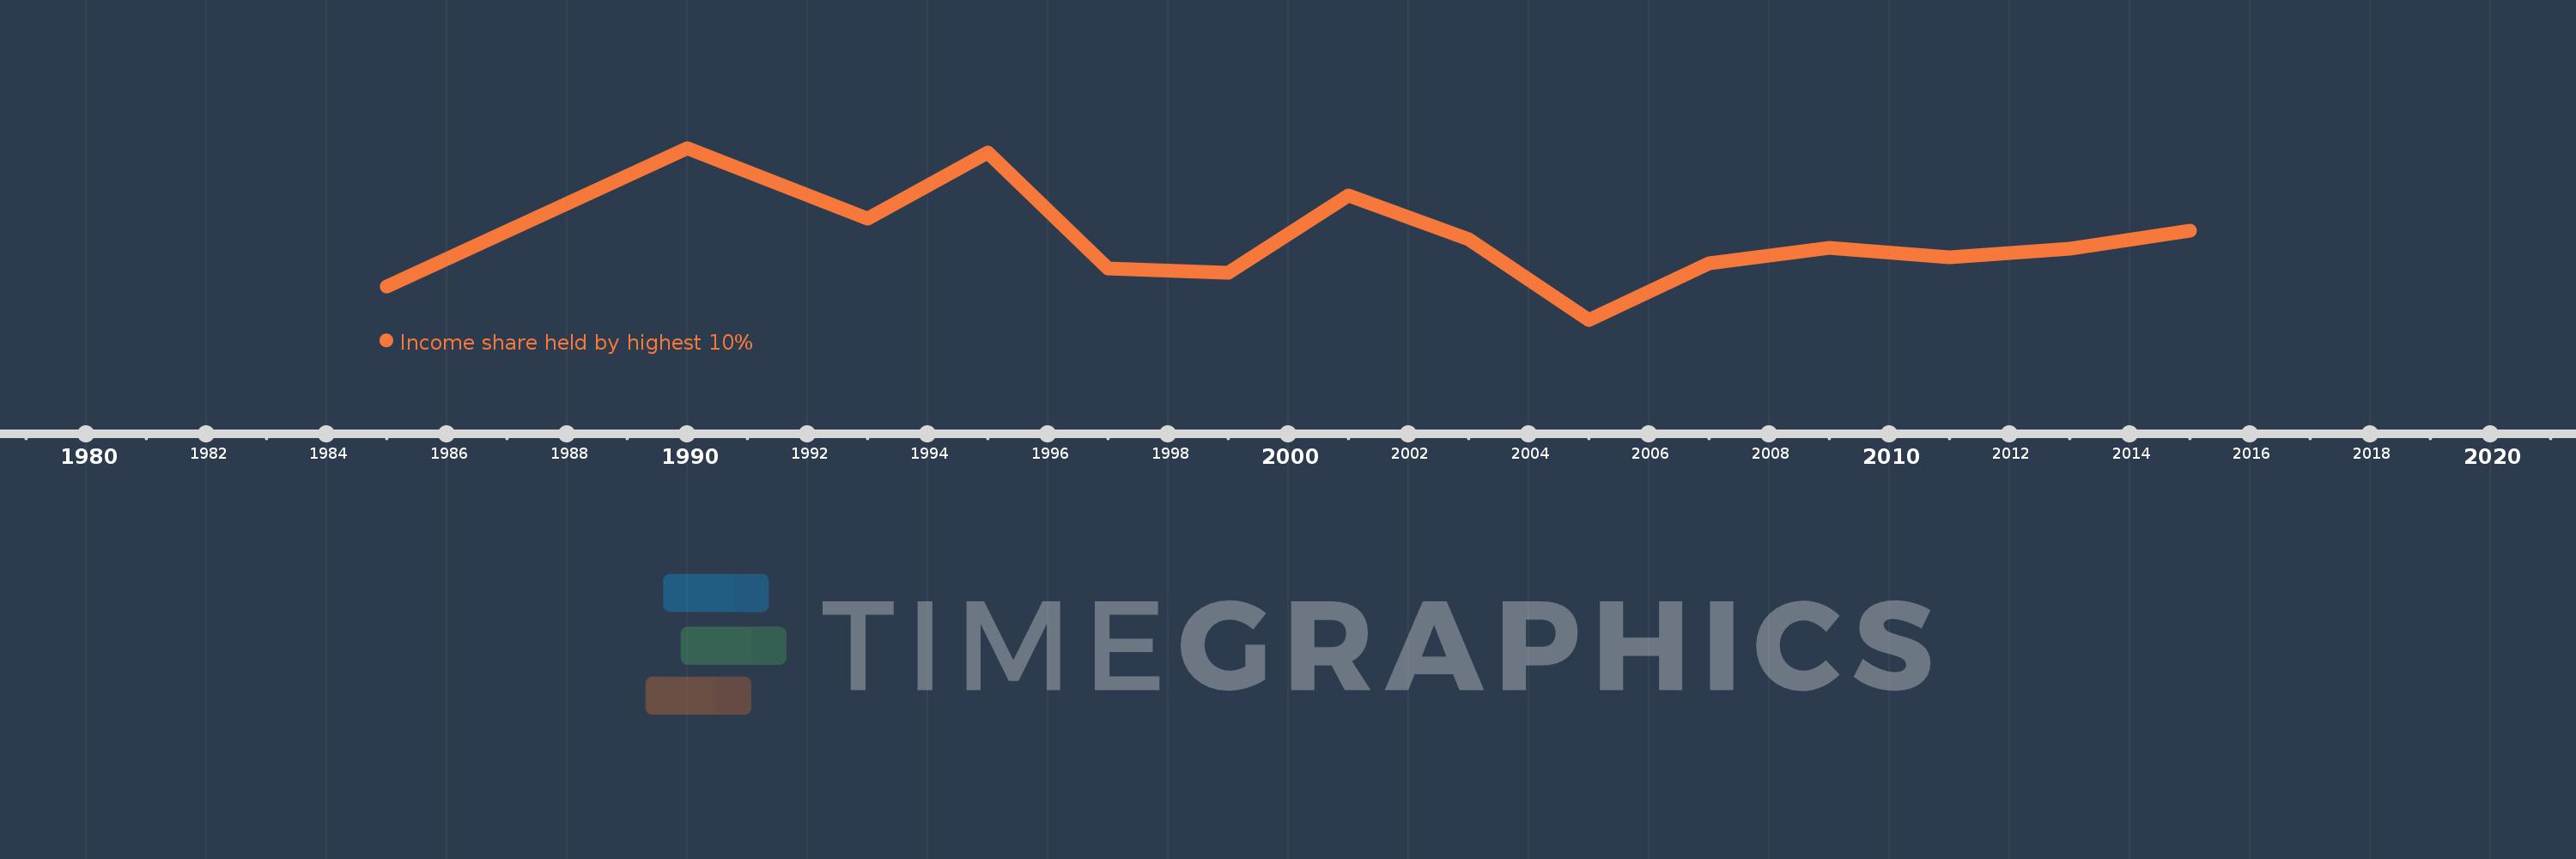
This timeline shows a graph from 1985 to 2015 of Mexico. No data until 1984. Number of actual observations by date: 14.
Source name:
World Development Indicators
Source organization:
World Bank, Development Research Group. Data are based on primary household survey data obtained from government statistical agencies and World Bank country departments. Data for high-income economies are from the Luxembourg Income Study database. For more information and methodology, please see PovcalNet (http://iresearch.worldbank.org/PovcalNet/index.htm).
Categories, topics:
Poverty
Last updated:
apr 23, 2017
Indicators value changes by year
Meaning:
39.291
Minimum:
35.48
jan 1, 2005
Maximum:
43.61
jan 1, 1990
At the date of observation
Value
Absolute change
Change from the previous value
jan 1, 1985
37.04
+37.04
0.0%
jan 1, 1990
43.61
+6.57
17.74%
jan 1, 1993
40.27
-3.34
-7.66%
jan 1, 1995
43.4
+3.13
7.77%
jan 1, 1997
37.91
-5.49
-12.65%
jan 1, 1999
37.72
-0.19
-0.5%
jan 1, 2001
41.35
+3.63
9.62%
jan 1, 2003
39.29
-2.06
-4.98%
jan 1, 2005
35.48
-3.81
-9.7%
jan 1, 2007
38.14
+2.66
7.5%
jan 1, 2009
38.87
+0.73
1.91%
jan 1, 2011
38.43
-0.44
-1.13%
jan 1, 2013
38.86
+0.43
1.12%
jan 1, 2015
39.7
+0.84
2.16%
Ranking of countries by current statistics by years
