29
/
en
AIzaSyAYiBZKx7MnpbEhh9jyipgxe19OcubqV5w
April 1, 2024
93707
Bulgaria
BGR
true
2
1
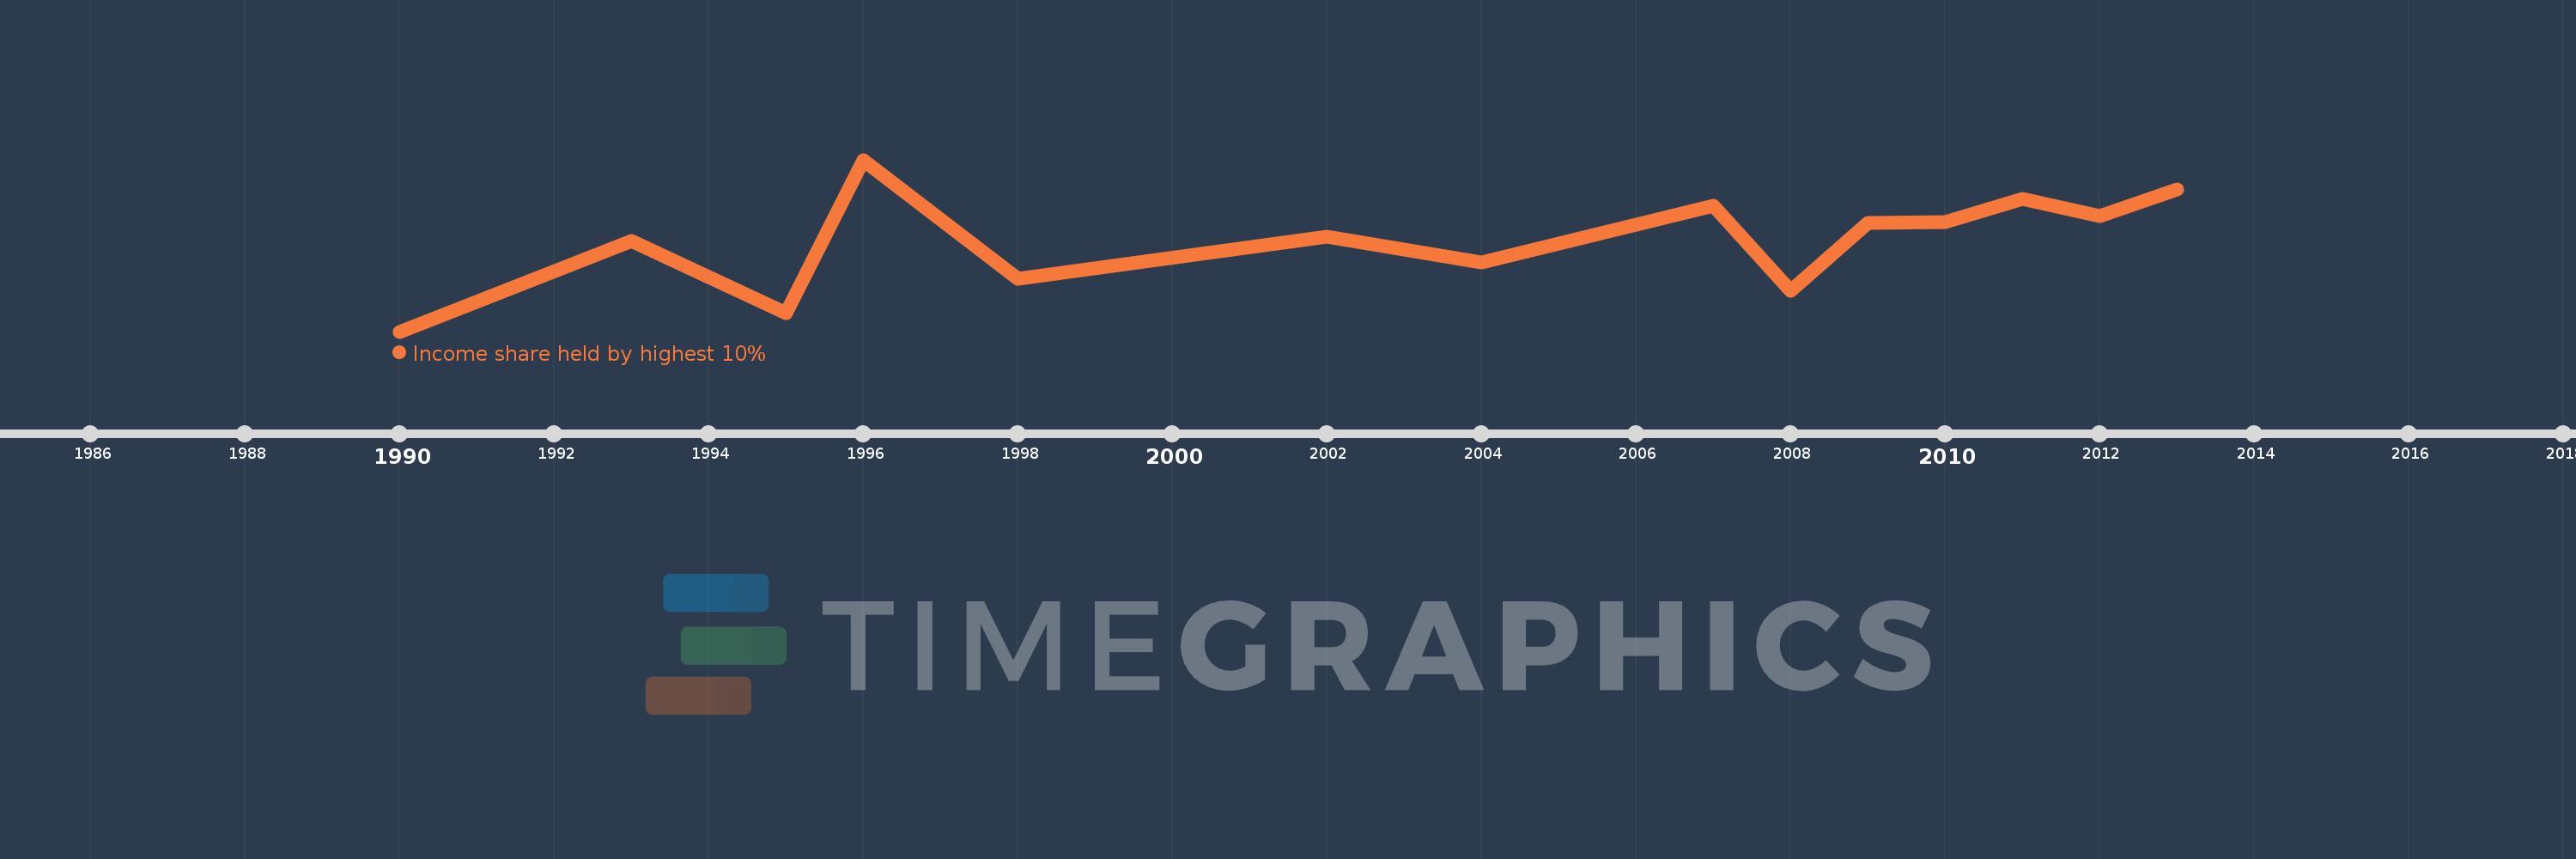
Income share held by highest 10%
2013,2012,2011,2010,2009,2008,2007,2004,2002,1998,1996,1995,1993,1990
This statistics in other country:
Timeline:
This timeline shows a graph from 1990 to 2013 of Bulgaria. No data until 1989. Number of actual observations by date: 14.
Source name:
World Development Indicators
Source organization:
World Bank, Development Research Group. Data are based on primary household survey data obtained from government statistical agencies and World Bank country departments. Data for high-income economies are from the Luxembourg Income Study database. For more information and methodology, please see PovcalNet (http://iresearch.worldbank.org/PovcalNet/index.htm).
Categories, topics:
Poverty
Last updated:
apr 23, 2017
Indicators value changes by year
At the date of observation
Value
Absolute change
Change from previous value
jan 1, 1990
20.03
+20.03
0.0%
jan 1, 1993
24.74
+4.71
23.51%
jan 1, 1995
20.99
-3.75
-15.16%
jan 1, 1996
28.93
+7.94
37.83%
jan 1, 1998
22.77
-6.16
-21.29%
jan 1, 2002
24.93
+2.16
9.49%
jan 1, 2004
23.63
-1.3
-5.21%
jan 1, 2007
26.57
+2.94
12.44%
jan 1, 2008
22.16
-4.41
-16.6%
jan 1, 2009
25.67
+3.51
15.84%
jan 1, 2010
25.69
+0.02
0.08%
jan 1, 2011
26.91
+1.22
4.75%
jan 1, 2012
26.03
-0.88
-3.27%
jan 1, 2013
27.38
+1.35
5.19%
Ranking of countries by current statistics by years


Comments: