29
/
en
AIzaSyAYiBZKx7MnpbEhh9jyipgxe19OcubqV5w
April 1, 2024
184382
Macedonia, FYR
MKD
true
2
1
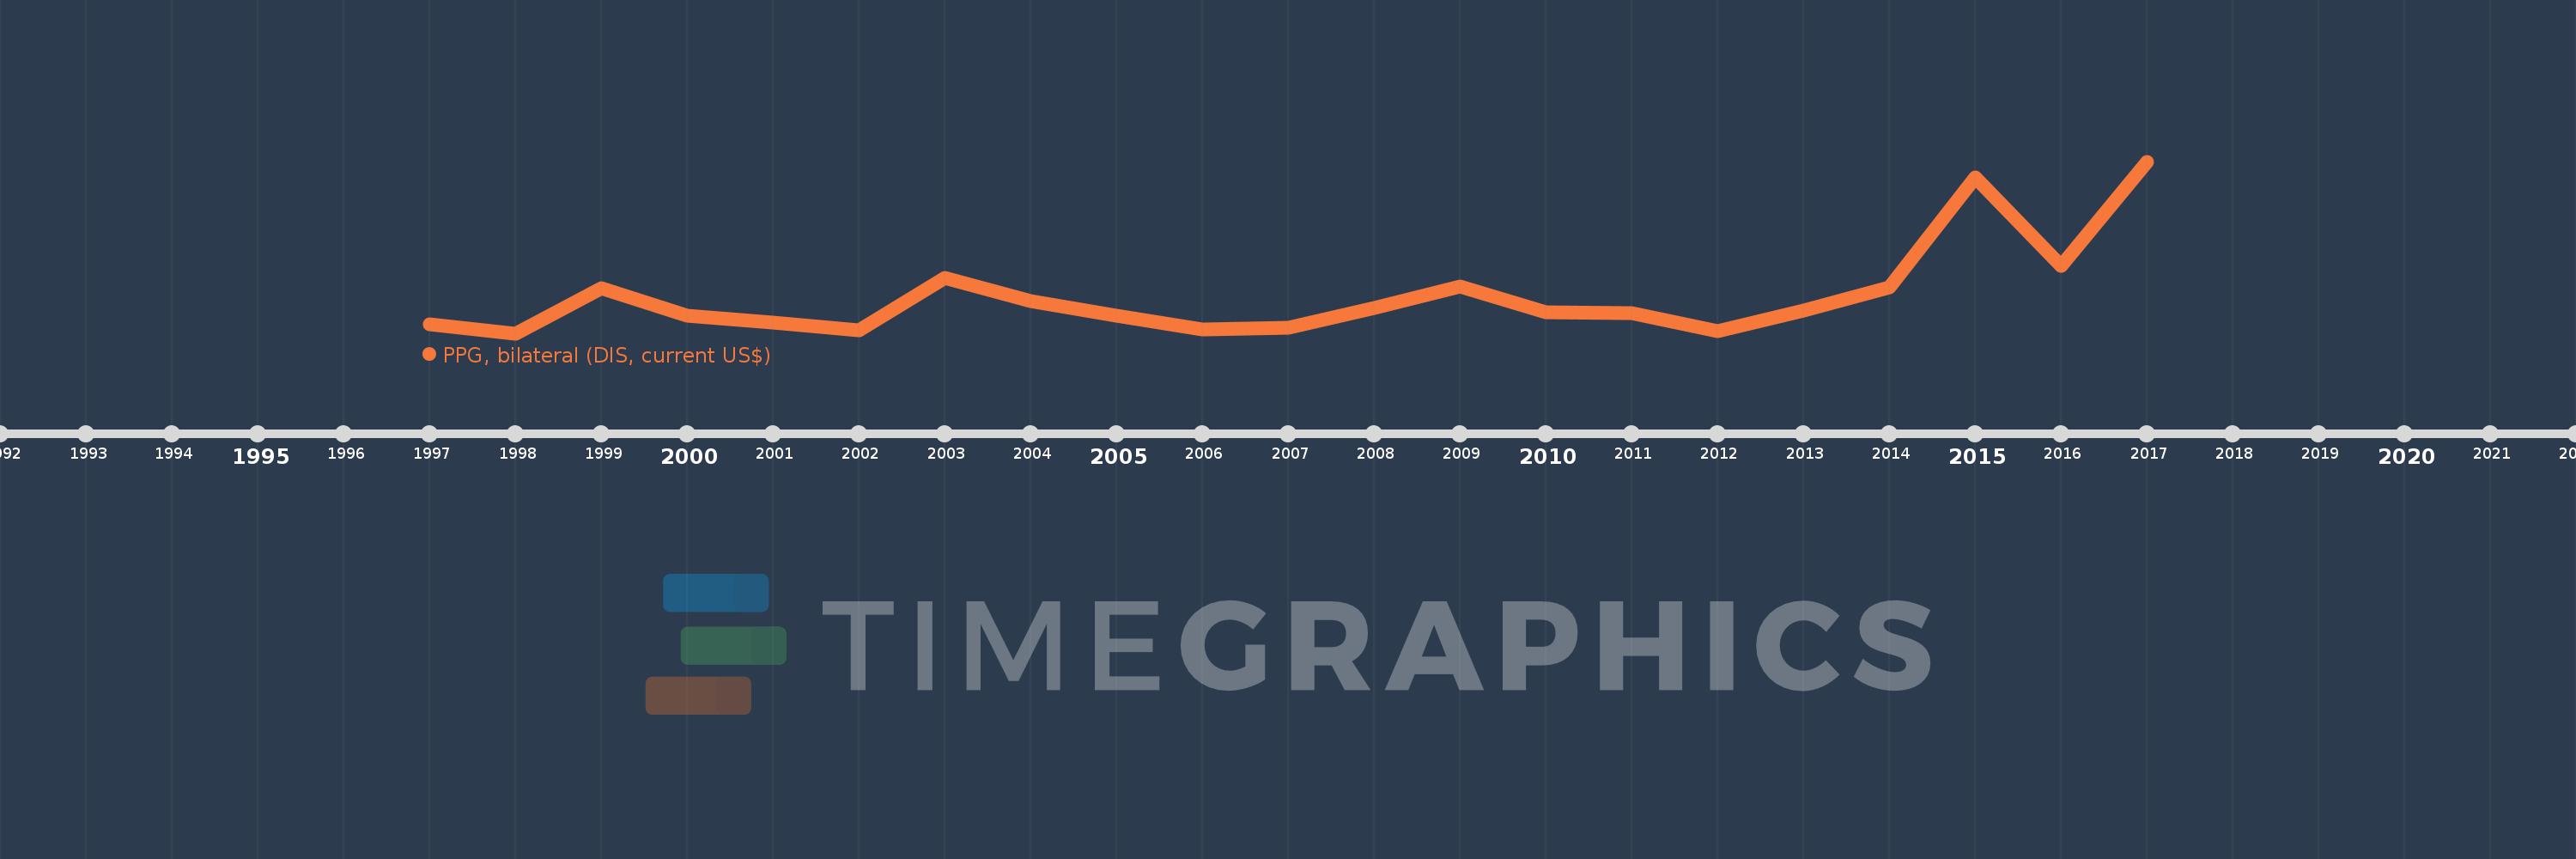
PPG, bilateral (DIS, current US$)
2017,2016,2015,2014,2013,2012,2011,2010,2009,2008,2007,2006,2005,2004,2003,2002,2001,2000,1999,1998,1997
This statistics in other country:
Timeline:
This timeline shows a graph from 1997 to 2017 of Macedonia, FYR. No data until 1996. Number of actual observations by date: 21.
Source name:
World Development Indicators
Source organization:
World Bank, International Debt Statistics.
Categories, topics:
External Debt
Last updated:
apr 23, 2017
Indicators value changes by year
Minimum:
6.701 mln
jan 1, 1998
Maximum:
173.259 mln
jan 1, 2017
At the date of observation
Value
Absolute change
Change from previous value
jan 1, 1997
15.042 mln
+15.042 mln
0.0%
jan 1, 1998
6.701 mln
-8.341 mln
-55.45%
jan 1, 1999
50.759 mln
+44.058 mln
657.48%
jan 1, 2000
23.414 mln
-27.345 mln
-53.87%
jan 1, 2001
17.337 mln
-6.077 mln
-25.95%
jan 1, 2002
9.6 mln
-7.737 mln
-44.63%
jan 1, 2003
60.81 mln
+51.21 mln
533.44%
jan 1, 2004
37.874 mln
-22.936 mln
-37.72%
jan 1, 2005
24.045 mln
-13.829 mln
-36.51%
jan 1, 2006
10.718 mln
-13.327 mln
-55.43%
jan 1, 2007
12.405 mln
+1.687 mln
15.74%
jan 1, 2008
30.859 mln
+18.454 mln
148.76%
jan 1, 2009
51.743 mln
+20.884 mln
67.68%
jan 1, 2010
27.016 mln
-24.727 mln
-47.79%
jan 1, 2011
26.348 mln
-668.0K
-2.47%
jan 1, 2012
9.05 mln
-17.298 mln
-65.65%
jan 1, 2013
28.859 mln
+19.809 mln
218.88%
jan 1, 2014
51.343 mln
+22.484 mln
77.91%
jan 1, 2015
157.806 mln
+106.463 mln
207.36%
jan 1, 2016
71.862 mln
-85.944 mln
-54.46%
jan 1, 2017
173.259 mln
+101.397 mln
141.1%
Ranking of countries by current statistics by years


Comments: