29
/
en
AIzaSyAYiBZKx7MnpbEhh9jyipgxe19OcubqV5w
April 1, 2024
230261
Russian Federation
RUS
true
2
1
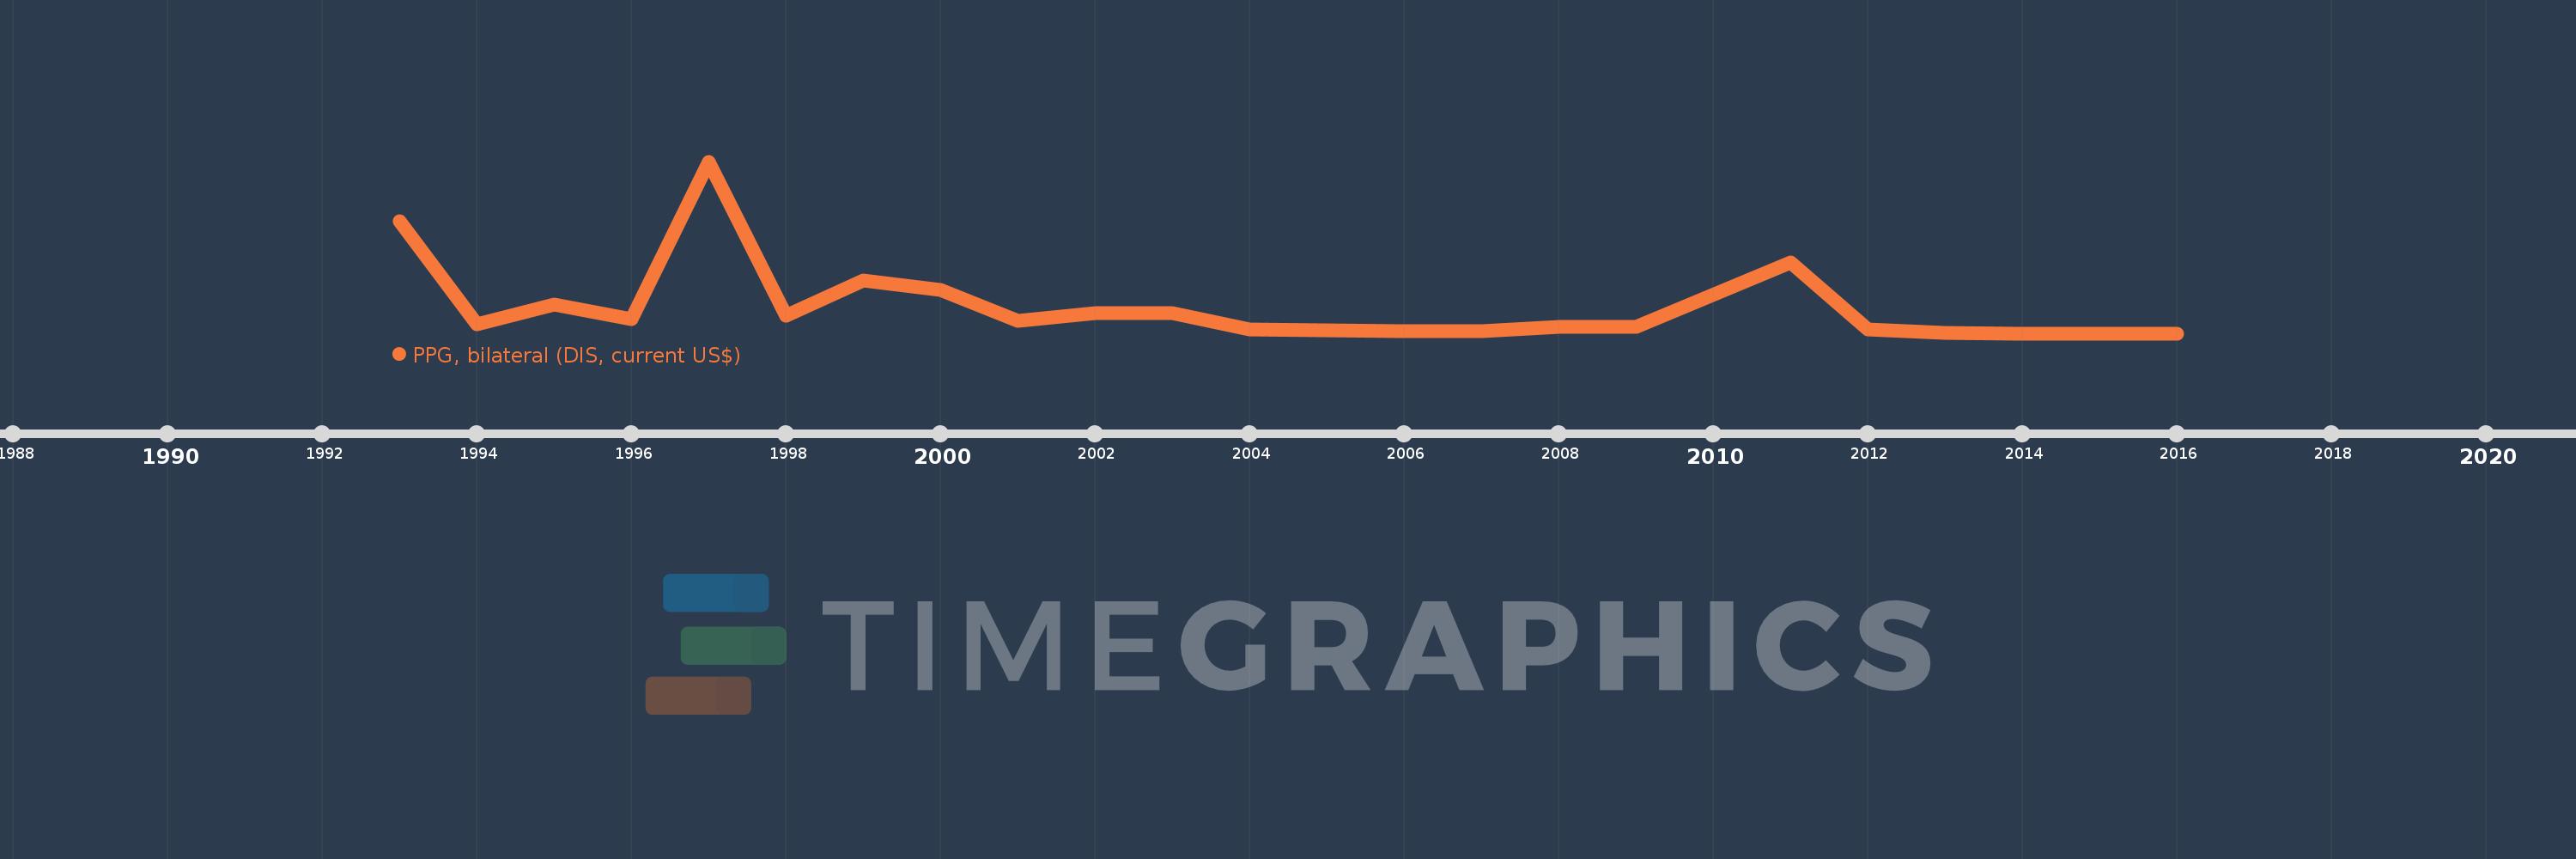
PPG, bilateral (DIS, current US$)
2016,2015,2014,2013,2012,2011,2009,2008,2007,2006,2005,2004,2003,2002,2001,2000,1999,1998,1997,1996,1995,1994,1993
This statistics in other country:
Timeline:
This timeline shows a graph from 1993 to 2016 of Russian Federation. No data until 1992. Number of actual observations by date: 23.
Source name:
World Development Indicators
Source organization:
World Bank, International Debt Statistics.
Categories, topics:
External Debt
Last updated:
apr 23, 2017
Indicators value changes by year
Maximum:
2.852 bln
jan 1, 1997
At the date of observation
Value
Absolute change
Change from previous value
jan 1, 1993
1.866 bln
+1.866 bln
0.0%
jan 1, 1994
148.344 mln
-1.717 bln
-92.05%
jan 1, 1995
483.972 mln
+335.628 mln
226.25%
jan 1, 1996
236.743 mln
-247.229 mln
-51.08%
jan 1, 1997
2.852 bln
+2.615 bln
1.1K%
jan 1, 1998
297.119 mln
-2.555 bln
-89.58%
jan 1, 1999
871.668 mln
+574.549 mln
193.37%
jan 1, 2000
726.685 mln
-144.983 mln
-16.63%
jan 1, 2001
201.757 mln
-524.928 mln
-72.24%
jan 1, 2002
335.333 mln
+133.576 mln
66.21%
jan 1, 2003
330.448 mln
-4.885 mln
-1.46%
jan 1, 2004
69.346 mln
-261.102 mln
-79.01%
jan 1, 2005
49.156 mln
-20.19 mln
-29.11%
jan 1, 2006
31.869 mln
-17.287 mln
-35.17%
jan 1, 2007
41.76 mln
+9.891 mln
31.04%
jan 1, 2008
100.0 mln
+58.24 mln
139.46%
jan 1, 2009
100.51 mln
+510.0K
0.51%
jan 1, 2011
1.181 bln
+1.08 bln
1.07K%
jan 1, 2012
60.56 mln
-1.12 bln
-94.87%
jan 1, 2013
800.0K
-59.76 mln
-98.68%
jan 1, 2014
0.0
-800.0K
-100.0%
Ranking of countries by current statistics by years


Comments: