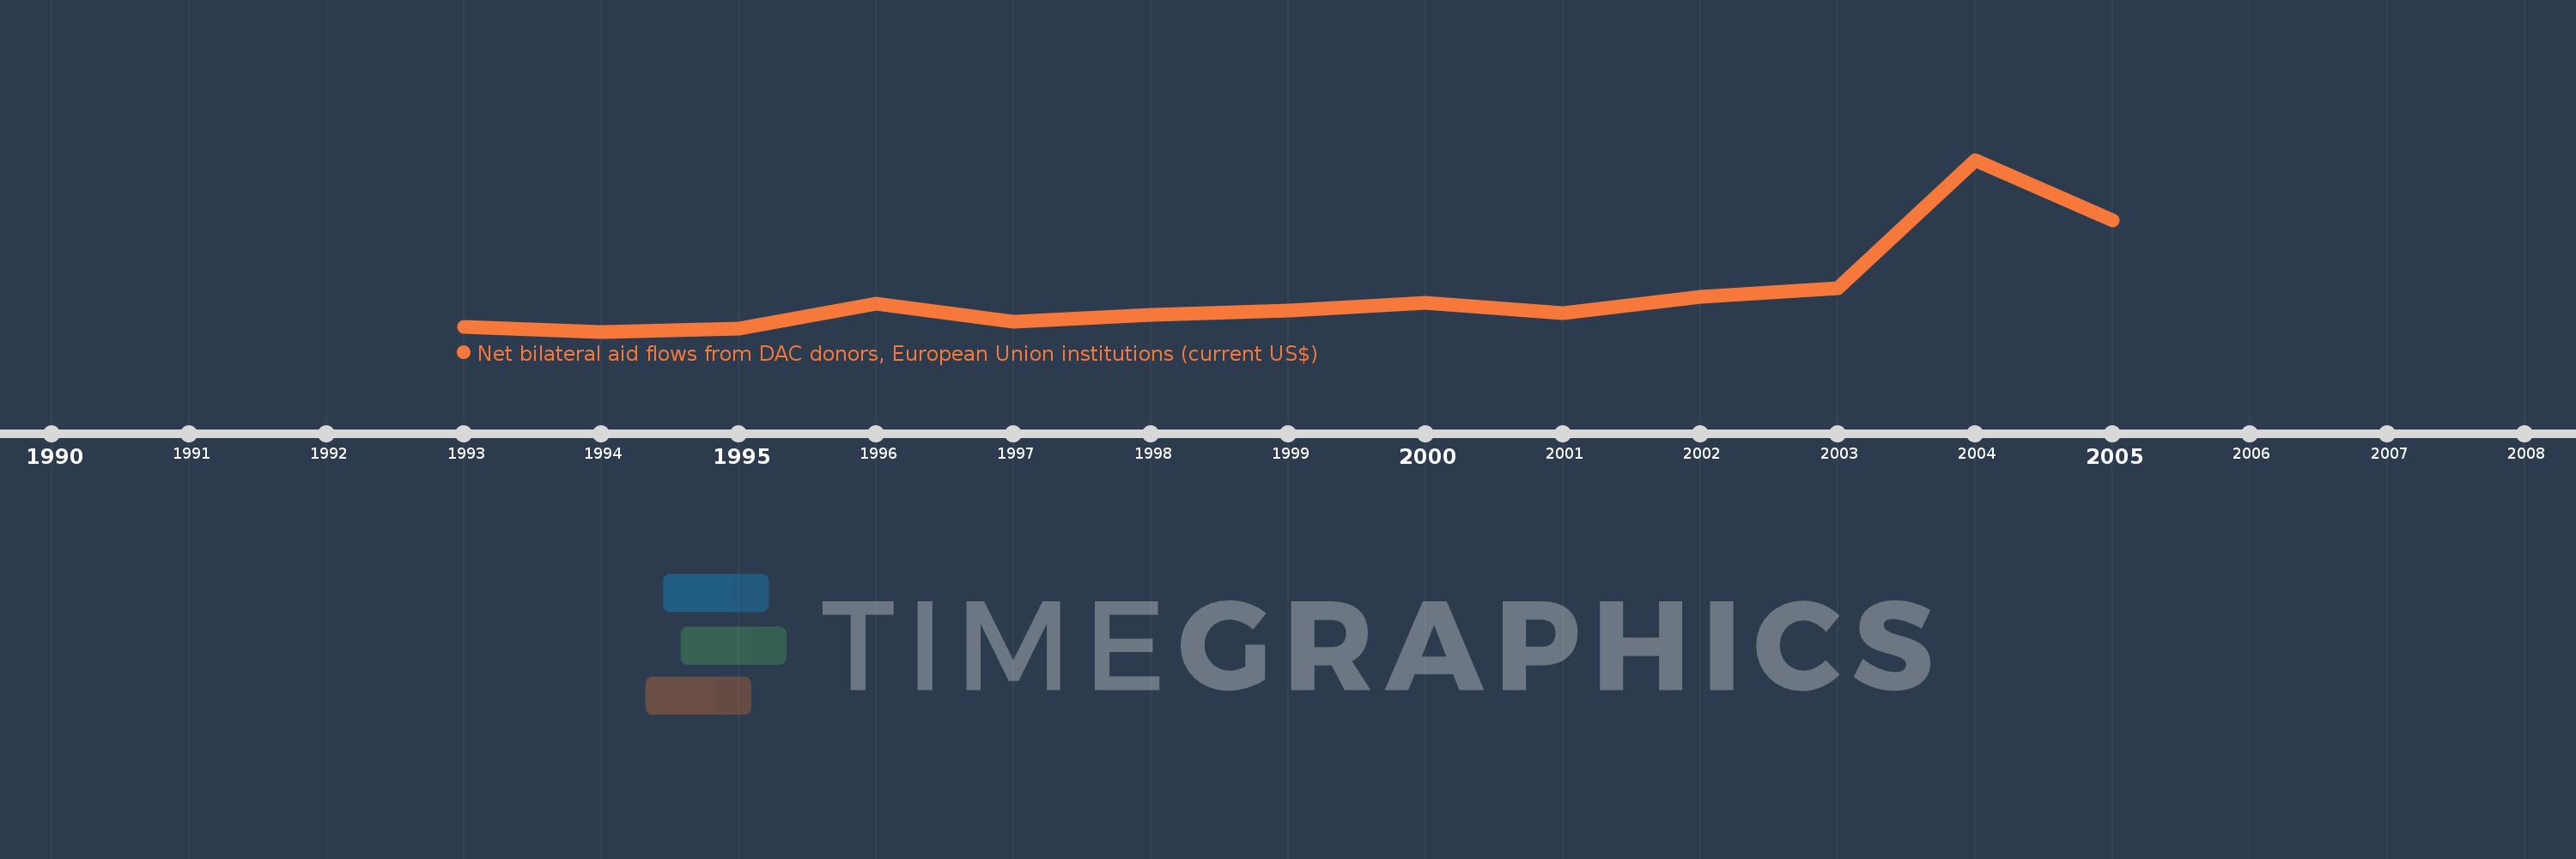
This timeline shows a graph from 1993 to 2005 of Lithuania. No data until 1992. Number of actual observations by date: 13.
Source name:
World Development Indicators
Source organization:
Development Assistance Committee of the Organisation for Economic Co-operation and Development, Geographical Distribution of Financial Flows to Developing Countries, Development Co-operation Report, and International Development Statistics database. Data are available online at: www.oecd.org/dac/stats/idsonline.
Categories, topics:
Aid Effectiveness
Last updated:
apr 23, 2017
Indicators value changes by year
Meaning:
81.525 mln
Minimum:
11.37 mln
jan 1, 1994
Maximum:
329.45 mln
jan 1, 2004
At the date of observation
Value
Absolute change
Change from the previous value
jan 1, 1993
20.86 mln
+20.86 mln
0.0%
jan 1, 1994
11.37 mln
-9.49 mln
-45.49%
jan 1, 1995
16.24 mln
+4.87 mln
42.83%
jan 1, 1996
63.25 mln
+47.01 mln
289.47%
jan 1, 1997
28.92 mln
-34.33 mln
-54.28%
jan 1, 1998
41.72 mln
+12.8 mln
44.26%
jan 1, 1999
50.61 mln
+8.89 mln
21.31%
jan 1, 2000
65.28 mln
+14.67 mln
28.99%
jan 1, 2001
45.74 mln
-19.54 mln
-29.93%
jan 1, 2002
76.45 mln
+30.71 mln
67.14%
jan 1, 2003
92.07 mln
+15.62 mln
20.43%
jan 1, 2004
329.45 mln
+237.38 mln
257.83%
jan 1, 2005
217.86 mln
-111.59 mln
-33.87%
Ranking of countries by current statistics by years
