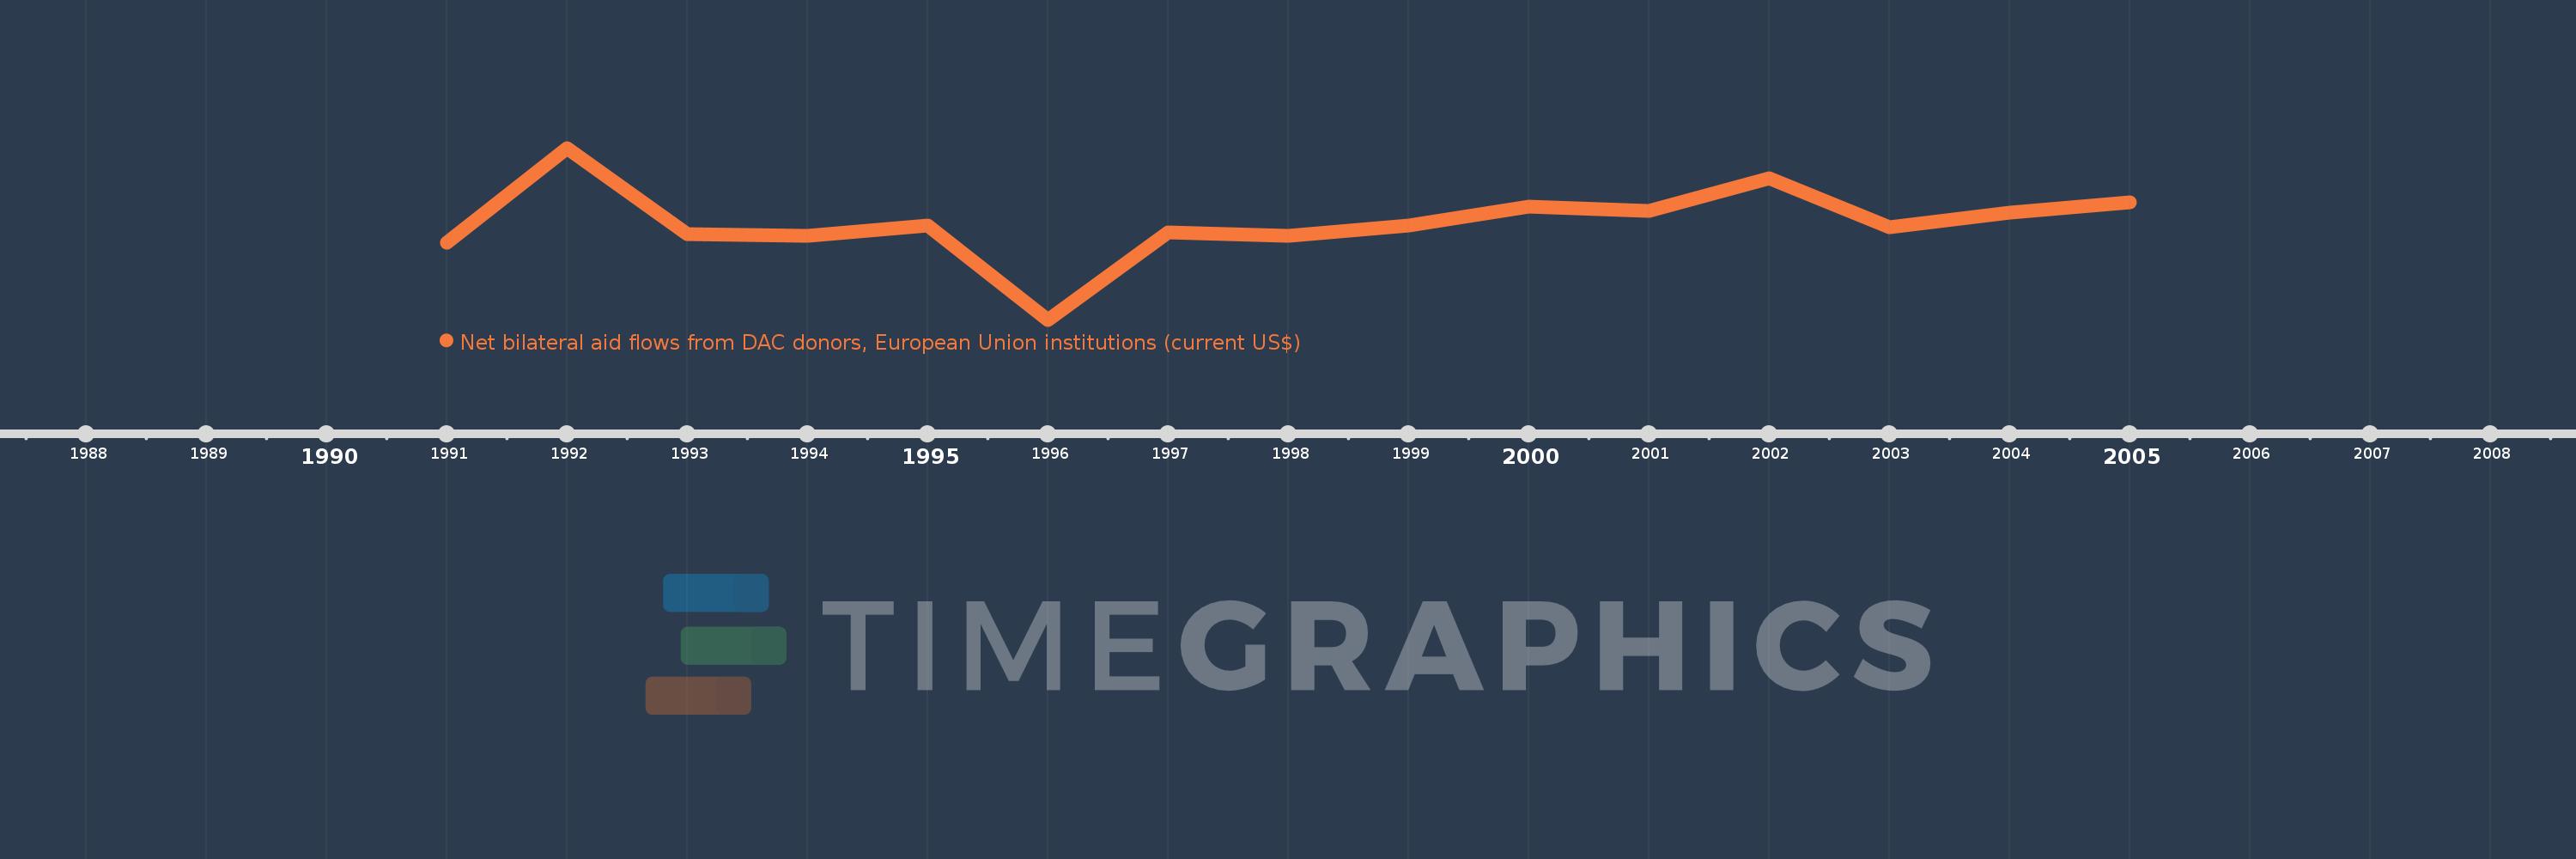
This timeline shows a graph from 1991 to 2005 of Hungary. No data until 1990. Number of actual observations by date: 15.
Source name:
World Development Indicators
Source organization:
Development Assistance Committee of the Organisation for Economic Co-operation and Development, Geographical Distribution of Financial Flows to Developing Countries, Development Co-operation Report, and International Development Statistics database. Data are available online at: www.oecd.org/dac/stats/idsonline.
Categories, topics:
Aid Effectiveness
Last updated:
apr 23, 2017
Indicators value changes by year
Meaning:
139.278 mln
Minimum:
-342.92 mln
jan 1, 1996
Maximum:
508.87 mln
jan 1, 1992
At the date of observation
Value
Absolute change
Change from the previous value
jan 1, 1991
37.45 mln
+37.45 mln
0.0%
jan 1, 1992
508.87 mln
+471.42 mln
1.26K%
jan 1, 1993
81.45 mln
-427.42 mln
-83.99%
jan 1, 1994
72.27 mln
-9.18 mln
-11.27%
jan 1, 1995
125.28 mln
+53.01 mln
73.35%
jan 1, 1996
-342.92 mln
-468.2 mln
-373.72%
jan 1, 1997
90.75 mln
+433.67 mln
-126.46%
jan 1, 1998
75.05 mln
-15.7 mln
-17.3%
jan 1, 1999
125.07 mln
+50.02 mln
66.65%
jan 1, 2000
216.27 mln
+91.2 mln
72.92%
jan 1, 2001
195.67 mln
-20.6 mln
-9.53%
jan 1, 2002
359.26 mln
+163.59 mln
83.61%
jan 1, 2003
116.98 mln
-242.28 mln
-67.44%
jan 1, 2004
189.91 mln
+72.93 mln
62.34%
jan 1, 2005
237.81 mln
+47.9 mln
25.22%
Ranking of countries by current statistics by years
