29
/
en
AIzaSyAYiBZKx7MnpbEhh9jyipgxe19OcubqV5w
April 1, 2024
179388
Liberia
LBR
true
2
1
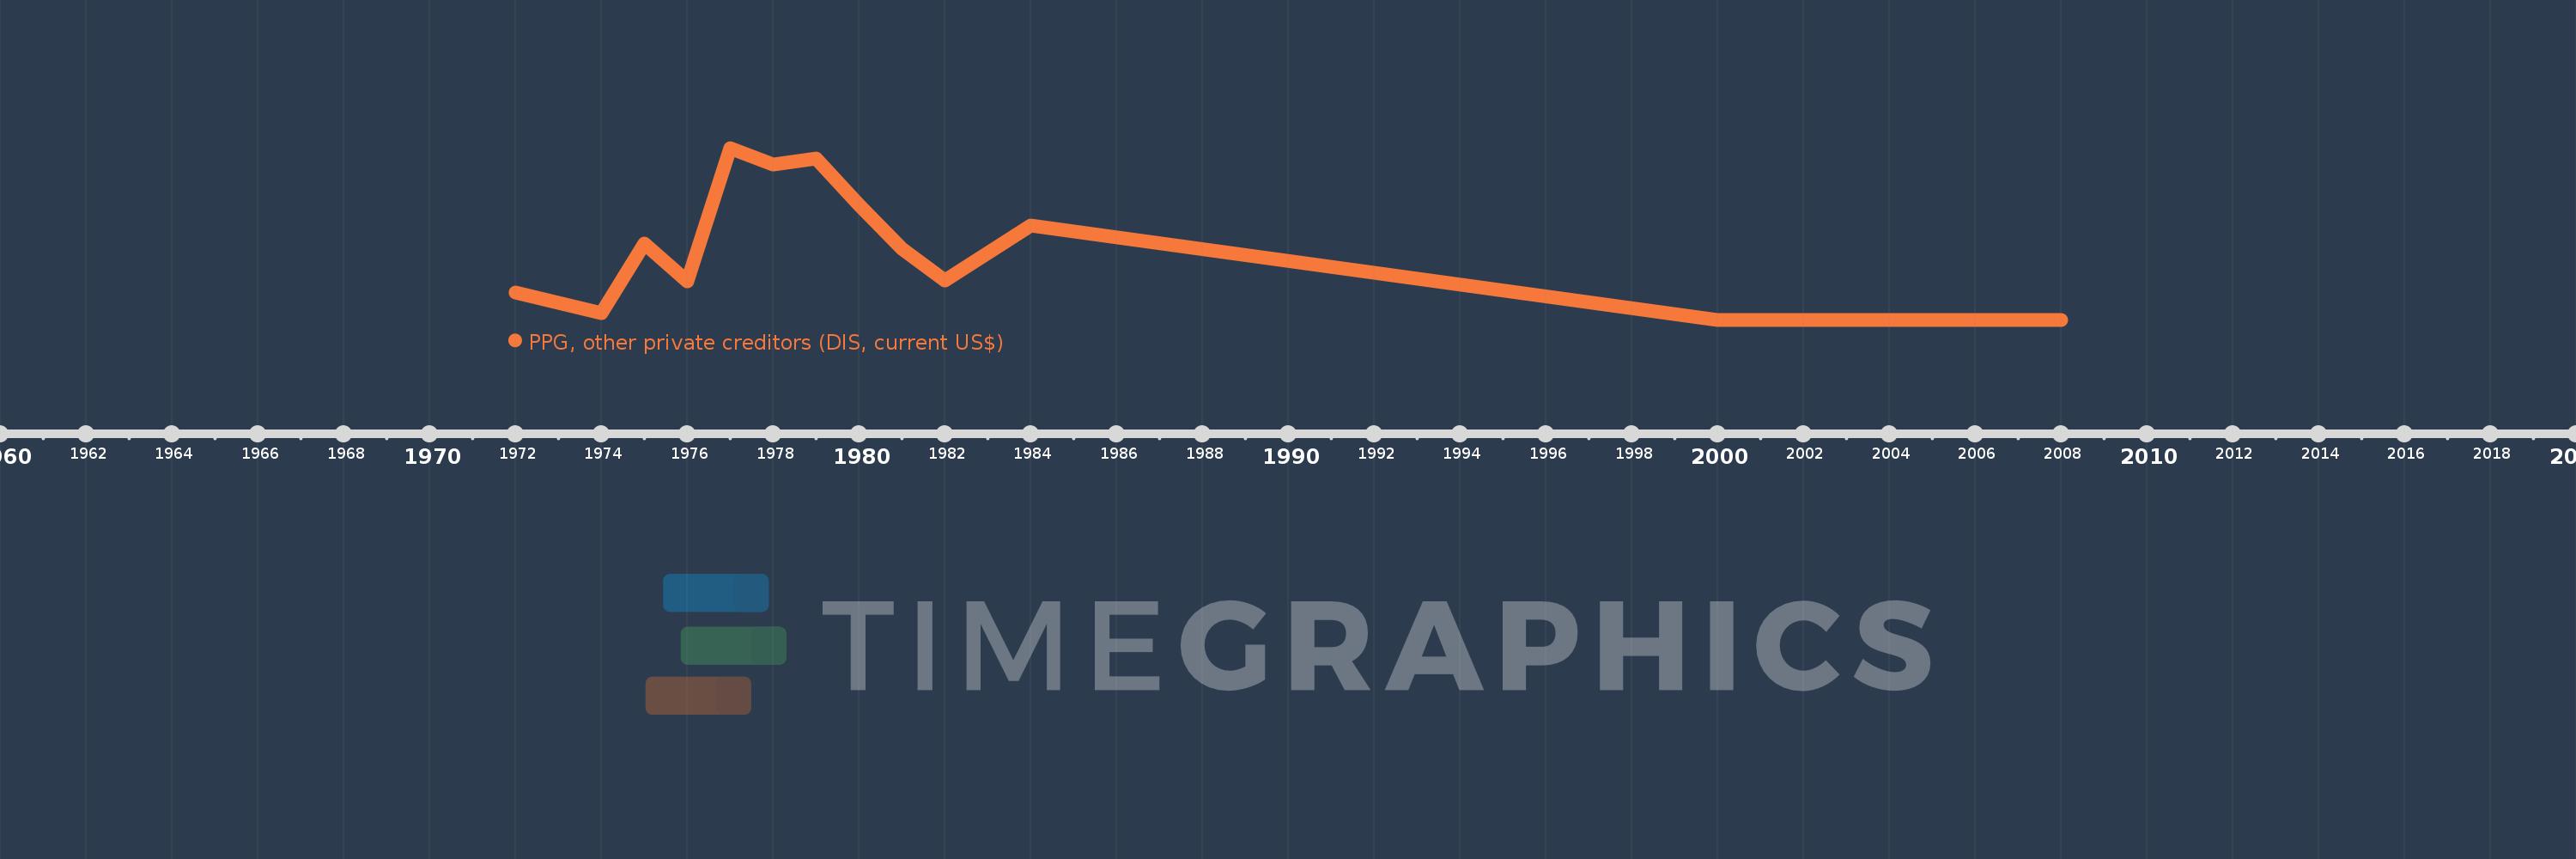
PPG, other private creditors (DIS, current US$)
2008,2007,2006,2005,2004,2003,2002,2001,2000,1984,1982,1981,1980,1979,1978,1977,1976,1975,1974,1972
This statistics in other country:
Timeline:
This timeline shows a graph from 1972 to 2008 of Liberia. No data until 1971. Number of actual observations by date: 20.
Source name:
World Development Indicators
Source organization:
World Bank, International Debt Statistics.
Categories, topics:
External Debt
Last updated:
apr 23, 2017
Indicators value changes by year
Maximum:
13.079 mln
jan 1, 1977
At the date of observation
Value
Absolute change
Change from previous value
jan 1, 1972
2.072 mln
+2.072 mln
0.0%
jan 1, 1974
500.0K
-1.572 mln
-75.87%
jan 1, 1975
5.775 mln
+5.275 mln
1.05K%
jan 1, 1976
2.943 mln
-2.832 mln
-49.04%
jan 1, 1977
13.079 mln
+10.136 mln
344.41%
jan 1, 1978
11.799 mln
-1.28 mln
-9.79%
jan 1, 1979
12.253 mln
+454.0K
3.85%
jan 1, 1980
8.727 mln
-3.526 mln
-28.78%
jan 1, 1981
5.376 mln
-3.351 mln
-38.4%
jan 1, 1982
2.958 mln
-2.418 mln
-44.98%
jan 1, 1984
7.164 mln
+4.206 mln
142.19%
jan 1, 2000
0.0
-7.164 mln
-100.0%
Ranking of countries by current statistics by years


Comments: