29
/
en
AIzaSyAYiBZKx7MnpbEhh9jyipgxe19OcubqV5w
April 1, 2024
147327
Guinea-Bissau
GNB
true
2
1
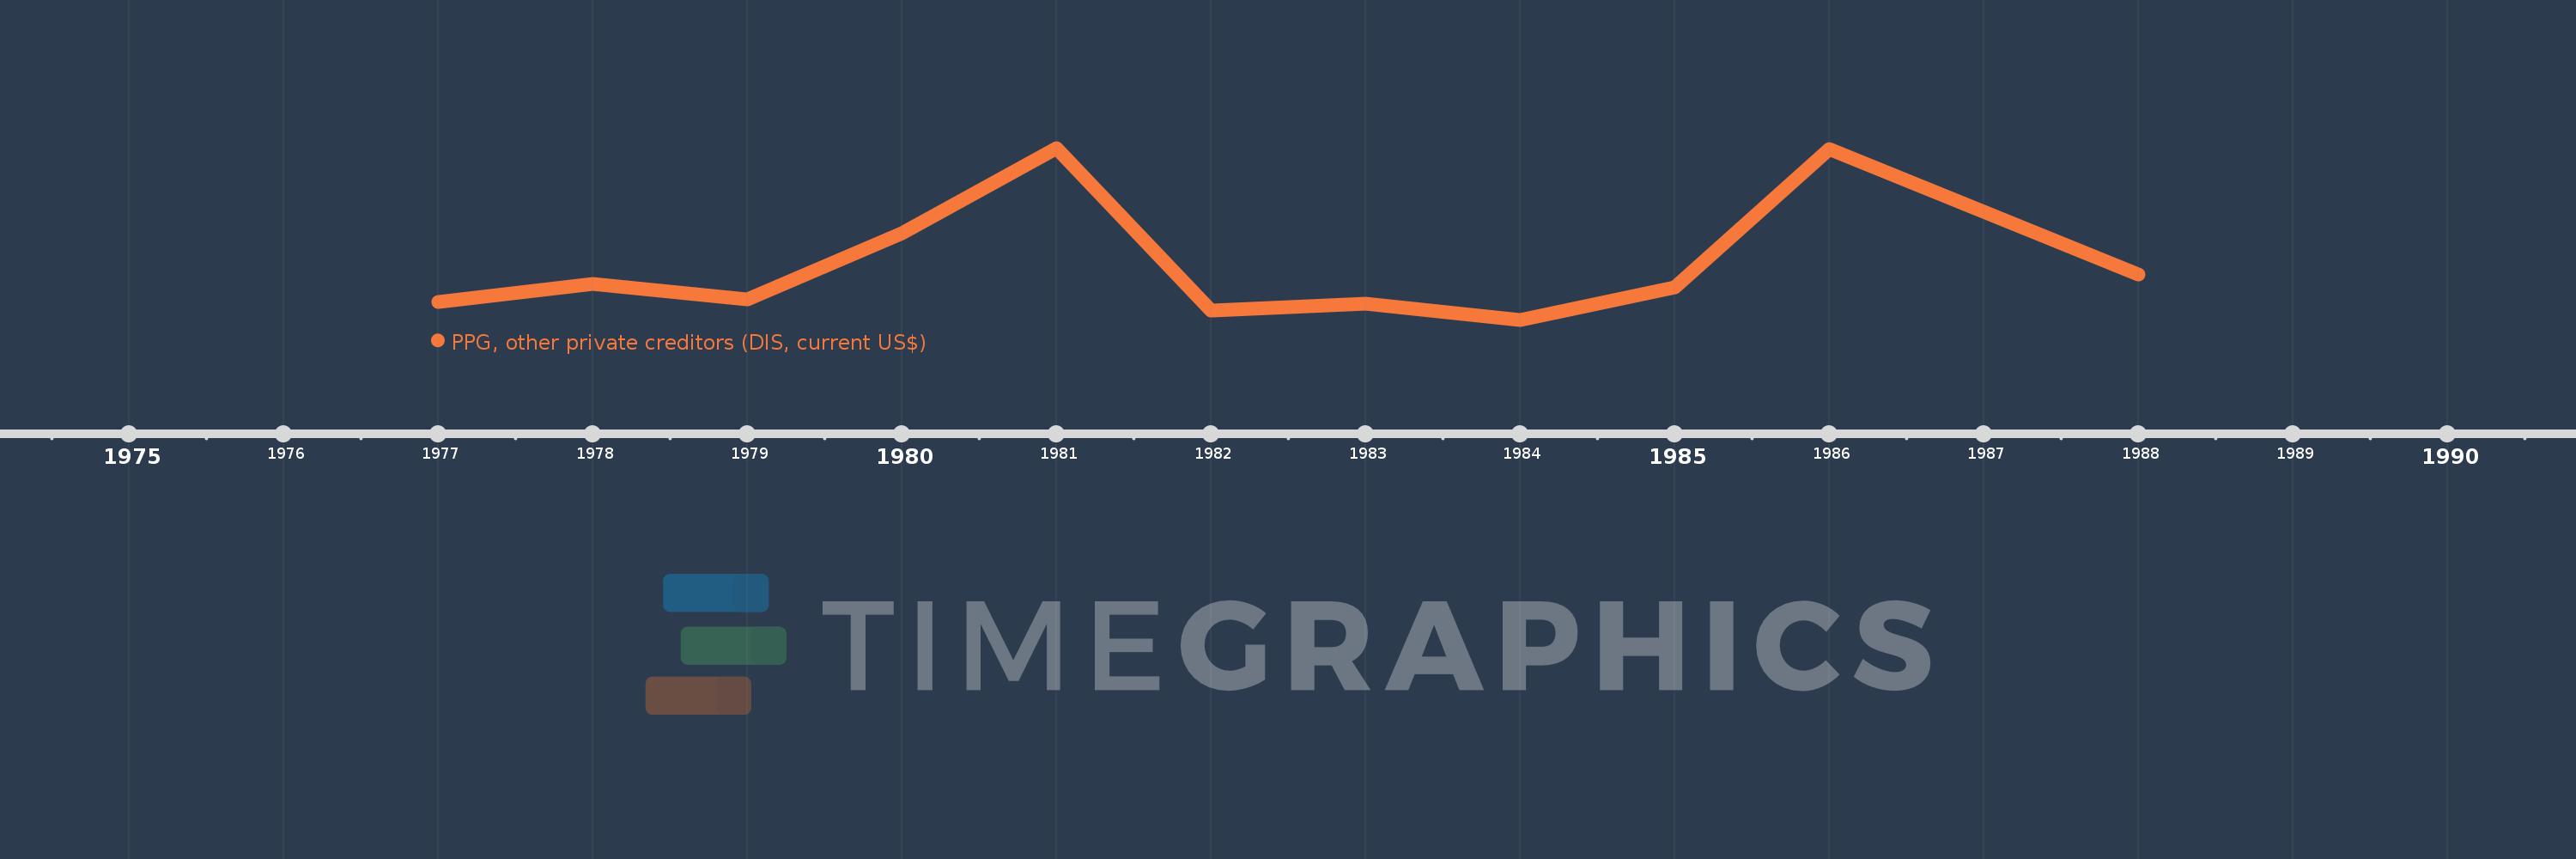
PPG, other private creditors (DIS, current US$)
1988,1986,1985,1984,1983,1982,1981,1980,1979,1978,1977
This statistics in other country:
Timeline:
This timeline shows a graph from 1977 to 1988 of Guinea-Bissau. No data until 1976. Number of actual observations by date: 11.
Source name:
World Development Indicators
Source organization:
World Bank, International Debt Statistics.
Categories, topics:
External Debt
Last updated:
apr 23, 2017
Indicators value changes by year
Maximum:
20.533 mln
jan 1, 1981
At the date of observation
Value
Absolute change
Change from previous value
jan 1, 1977
2.171 mln
+2.171 mln
0.0%
jan 1, 1978
4.347 mln
+2.176 mln
100.23%
jan 1, 1979
2.487 mln
-1.86 mln
-42.79%
jan 1, 1980
10.361 mln
+7.874 mln
316.61%
jan 1, 1981
20.533 mln
+10.172 mln
98.18%
jan 1, 1982
1.115 mln
-19.418 mln
-94.57%
jan 1, 1983
1.976 mln
+861.0K
77.22%
jan 1, 1984
48.0K
-1.928 mln
-97.57%
jan 1, 1985
3.913 mln
+3.865 mln
8.05K%
jan 1, 1986
20.383 mln
+16.47 mln
420.9%
jan 1, 1988
5.496 mln
-14.887 mln
-73.04%
Ranking of countries by current statistics by years


Comments: