29
/
en
AIzaSyAYiBZKx7MnpbEhh9jyipgxe19OcubqV5w
April 1, 2024
176209
Lebanon
LBN
true
2
1
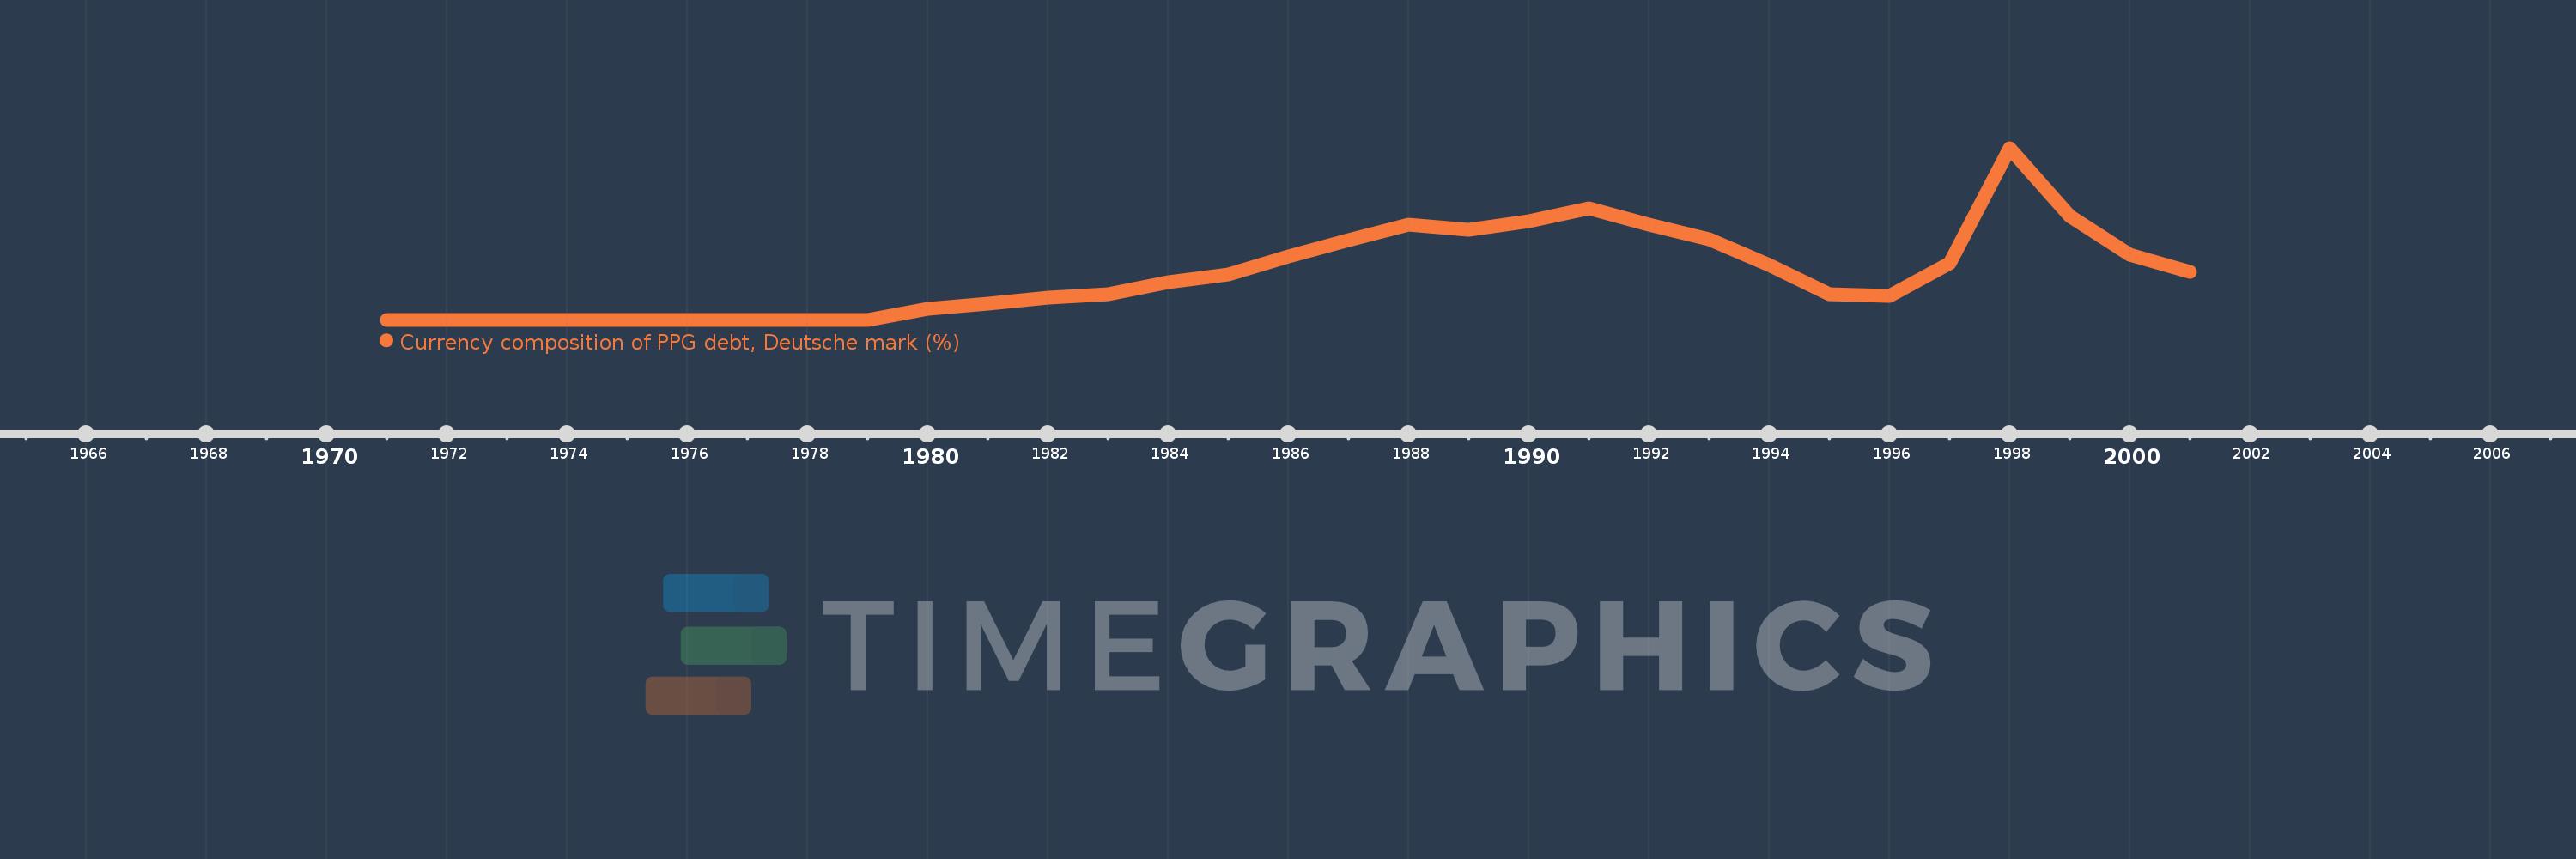
Currency composition of PPG debt, Deutsche mark (%)
2001,2000,1999,1998,1997,1996,1995,1994,1993,1992,1991,1990,1989,1988,1987,1986,1985,1984,1983,1982,1981,1980,1979,1978,1977,1976,1975,1974,1973,1972,1971
This statistics in other country:
Timeline:
This timeline shows a graph from 1971 to 2001 of Lebanon. No data until 1970. Number of actual observations by date: 31.
Source name:
World Development Indicators
Source organization:
World Bank, International Debt Statistics.
Categories, topics:
External Debt
Last updated:
apr 23, 2017
Indicators value changes by year
At the date of observation
Value
Absolute change
Change from previous value
jan 1, 1980
0.494
+0.494
%
jan 1, 1981
0.75
+0.256
51.86%
jan 1, 1982
1.048
+0.298
39.7%
jan 1, 1983
1.184
+0.137
13.04%
jan 1, 1984
1.772
+0.588
49.61%
jan 1, 1985
2.114
+0.342
19.3%
jan 1, 1986
2.953
+0.84
39.72%
jan 1, 1987
3.728
+0.775
26.24%
jan 1, 1988
4.476
+0.748
20.07%
jan 1, 1989
4.217
-0.259
-5.78%
jan 1, 1990
4.64
+0.423
10.02%
jan 1, 1991
5.216
+0.576
12.41%
jan 1, 1992
4.473
-0.743
-14.25%
jan 1, 1993
3.771
-0.702
-15.69%
jan 1, 1994
2.567
-1.204
-31.92%
jan 1, 1995
1.185
-1.382
-53.84%
jan 1, 1996
1.102
-0.083
-7.03%
jan 1, 1997
2.668
+1.567
142.24%
jan 1, 1998
8.063
+5.395
202.17%
jan 1, 1999
4.85
-3.213
-39.85%
jan 1, 2000
3.072
-1.778
-36.67%
jan 1, 2001
2.261
-0.811
-26.39%
Ranking of countries by current statistics by years


Comments: