29
/
en
AIzaSyAYiBZKx7MnpbEhh9jyipgxe19OcubqV5w
April 1, 2024
211533
Niger
NER
true
2
1
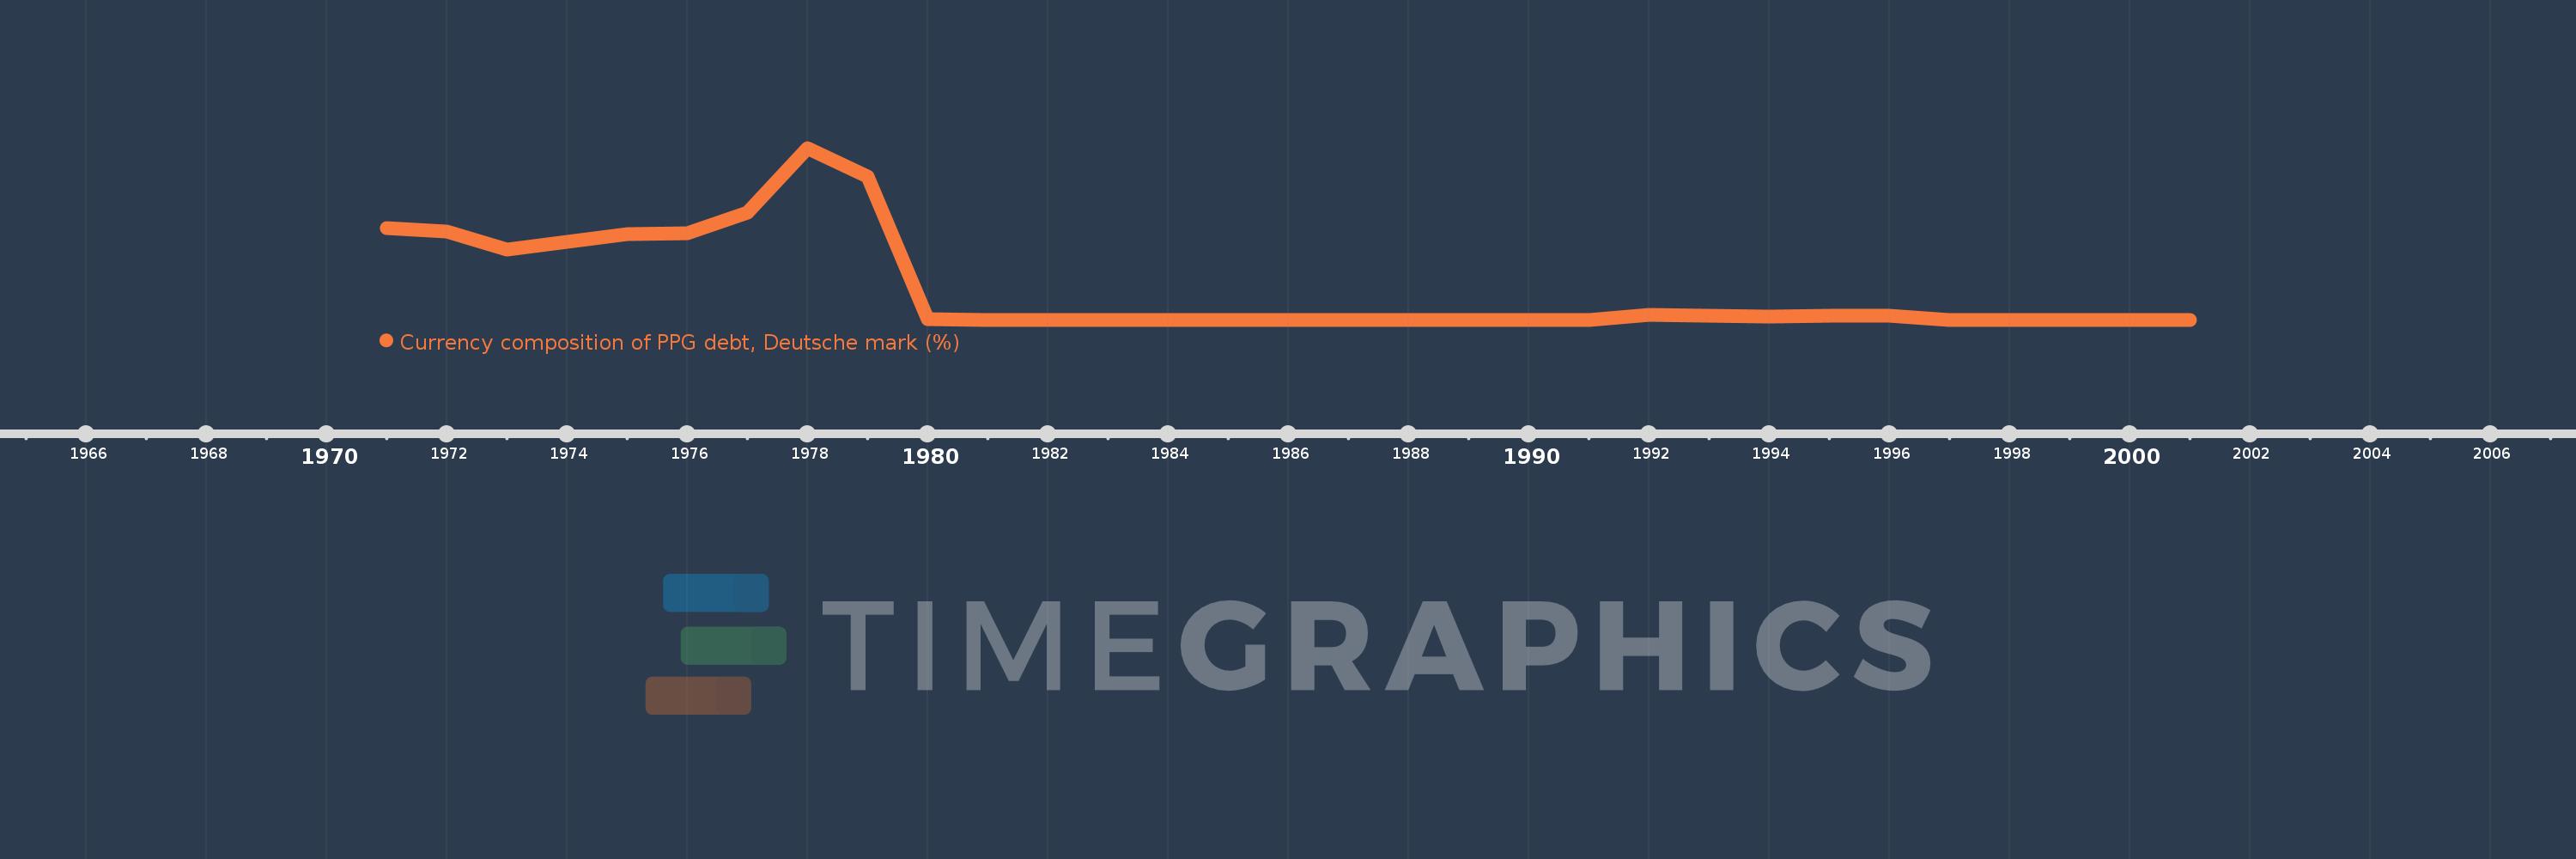
Currency composition of PPG debt, Deutsche mark (%)
2001,2000,1999,1998,1997,1996,1995,1994,1993,1992,1991,1990,1989,1988,1987,1986,1985,1984,1983,1982,1981,1980,1979,1978,1977,1976,1975,1974,1973,1972,1971
This statistics in other country:
Timeline:
This timeline shows a graph from 1971 to 2001 of Niger. No data until 1970. Number of actual observations by date: 31.
Source name:
World Development Indicators
Source organization:
World Bank, International Debt Statistics.
Categories, topics:
External Debt
Last updated:
apr 23, 2017
Indicators value changes by year
At the date of observation
Value
Absolute change
Change from previous value
jan 1, 1971
12.006
+12.006
0.0%
jan 1, 1972
11.613
-0.393
-3.28%
jan 1, 1973
9.235
-2.378
-20.47%
jan 1, 1974
10.26
+1.025
11.1%
jan 1, 1975
11.219
+0.959
9.34%
jan 1, 1976
11.4
+0.182
1.62%
jan 1, 1977
14.093
+2.693
23.62%
jan 1, 1978
22.59
+8.497
60.29%
jan 1, 1979
18.877
-3.713
-16.44%
jan 1, 1980
0.056
-18.821
-99.7%
jan 1, 1981
0.0
-0.056
-100.0%
jan 1, 1992
0.607
+0.607
%
jan 1, 1993
0.556
-0.05
-8.31%
jan 1, 1994
0.47
-0.086
-15.52%
jan 1, 1995
0.5
+0.031
6.51%
jan 1, 1996
0.511
+0.011
2.1%
jan 1, 1997
0.0
-0.511
-100.0%
Ranking of countries by current statistics by years


Comments: