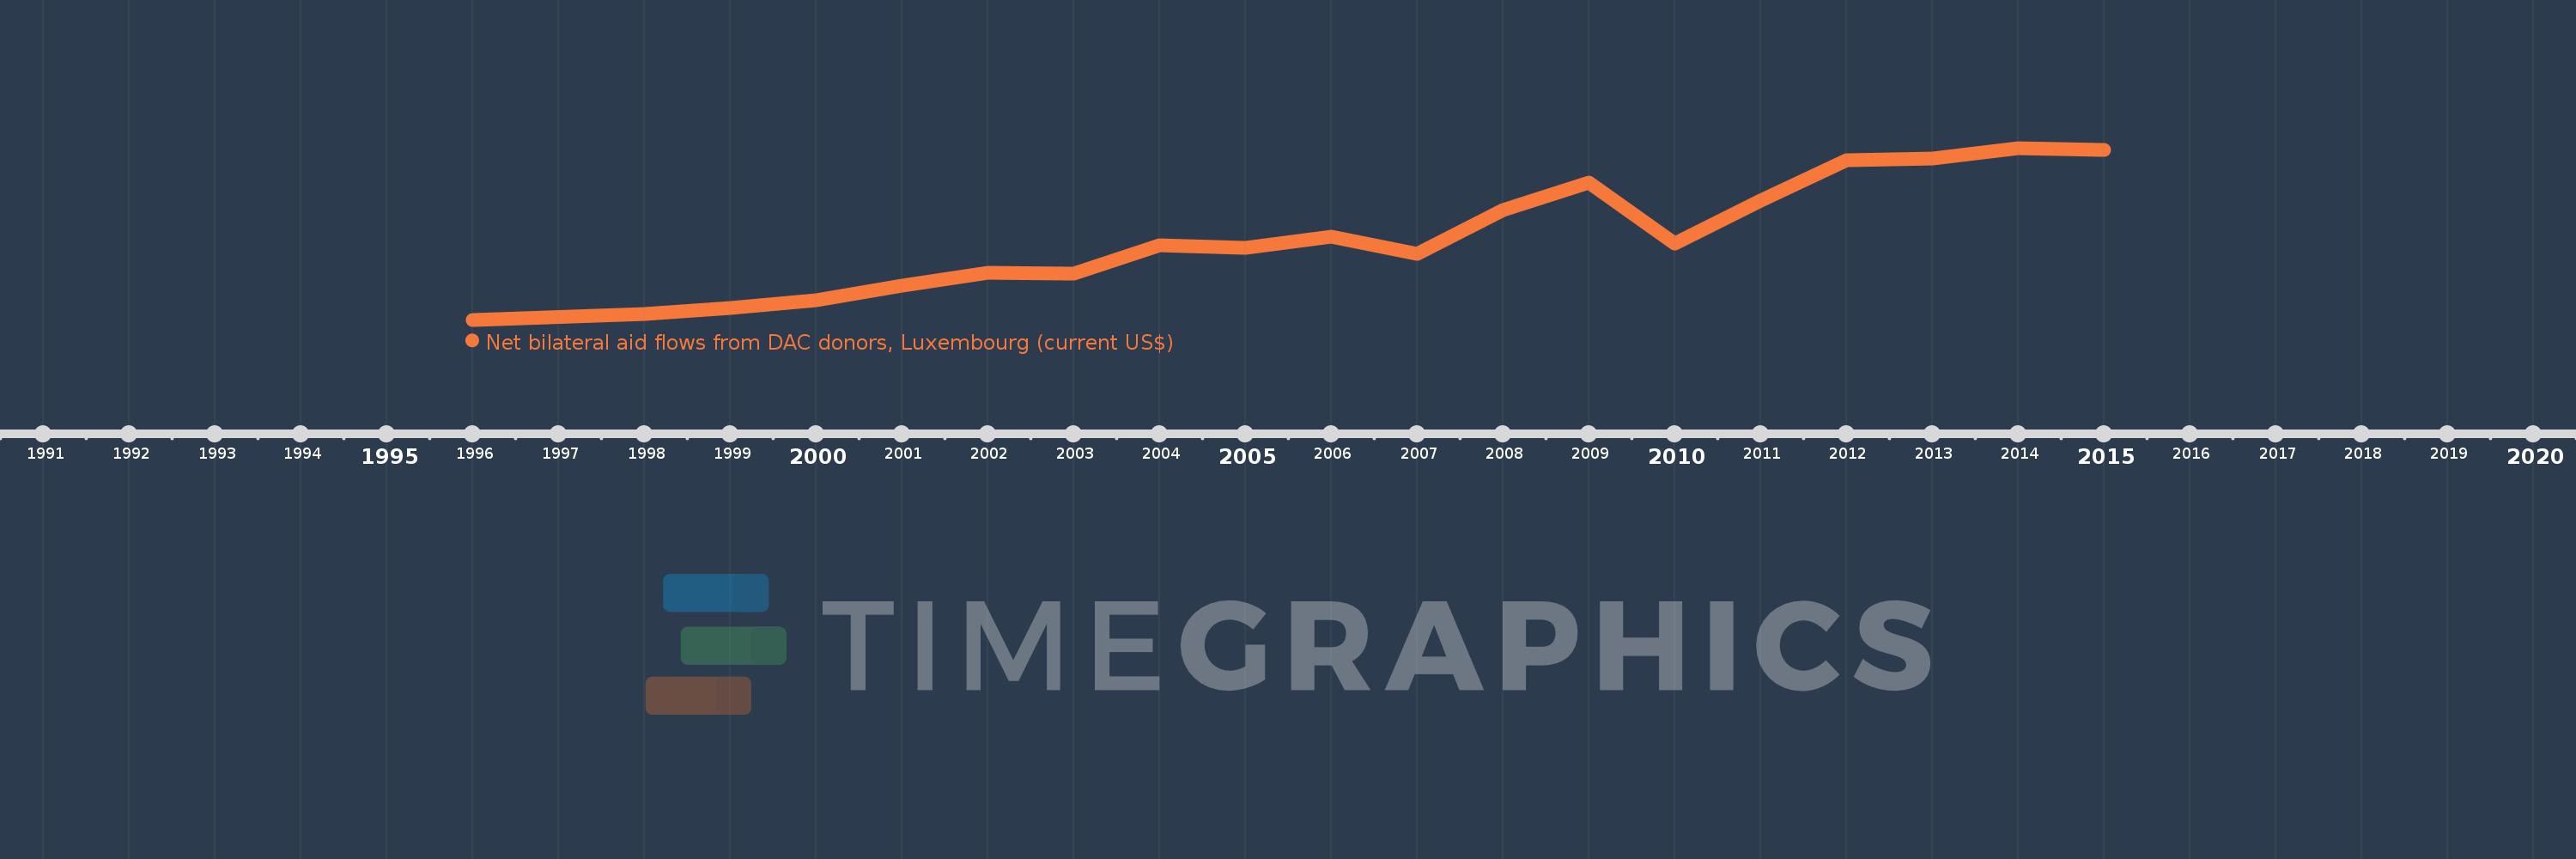
This timeline shows a graph from 1996 to 2015 of Lao PDR. No data until 1995. Number of actual observations by date: 19.
Source name:
World Development Indicators
Source organization:
Development Assistance Committee of the Organisation for Economic Co-operation and Development, Geographical Distribution of Financial Flows to Developing Countries, Development Co-operation Report, and International Development Statistics database. Data are available online at: www.oecd.org/dac/stats/idsonline.
Categories, topics:
Aid Effectiveness
Last updated:
apr 23, 2017
Indicators value changes by year
Meaning:
8.522 mln
Minimum:
20.0K
jan 1, 1996
Maximum:
17.76 mln
jan 1, 2014
At the date of observation
Value
Absolute change
Change from the previous value
jan 1, 1996
20.0K
+20.0K
0.0%
jan 1, 1998
580.0K
+560.0K
2.8K%
jan 1, 1999
1.25 mln
+670.0K
115.52%
jan 1, 2000
2.03 mln
+780.0K
62.4%
jan 1, 2001
3.53 mln
+1.5 mln
73.89%
jan 1, 2002
4.85 mln
+1.32 mln
37.39%
jan 1, 2003
4.74 mln
-110.0K
-2.27%
jan 1, 2004
7.75 mln
+3.01 mln
63.5%
jan 1, 2005
7.42 mln
-330.0K
-4.26%
jan 1, 2006
8.56 mln
+1.14 mln
15.36%
jan 1, 2007
6.8 mln
-1.76 mln
-20.56%
jan 1, 2008
11.34 mln
+4.54 mln
66.76%
jan 1, 2009
14.21 mln
+2.87 mln
25.31%
jan 1, 2010
7.91 mln
-6.3 mln
-44.33%
jan 1, 2011
12.35 mln
+4.44 mln
56.13%
jan 1, 2012
16.53 mln
+4.18 mln
33.85%
jan 1, 2013
16.69 mln
+160.0K
0.97%
jan 1, 2014
17.76 mln
+1.07 mln
6.41%
jan 1, 2015
17.6 mln
-160.0K
-0.9%
Ranking of countries by current statistics by years
