29
/
en
AIzaSyAYiBZKx7MnpbEhh9jyipgxe19OcubqV5w
April 1, 2024
41719
Latin America & Caribbean
LCN
false
2
1
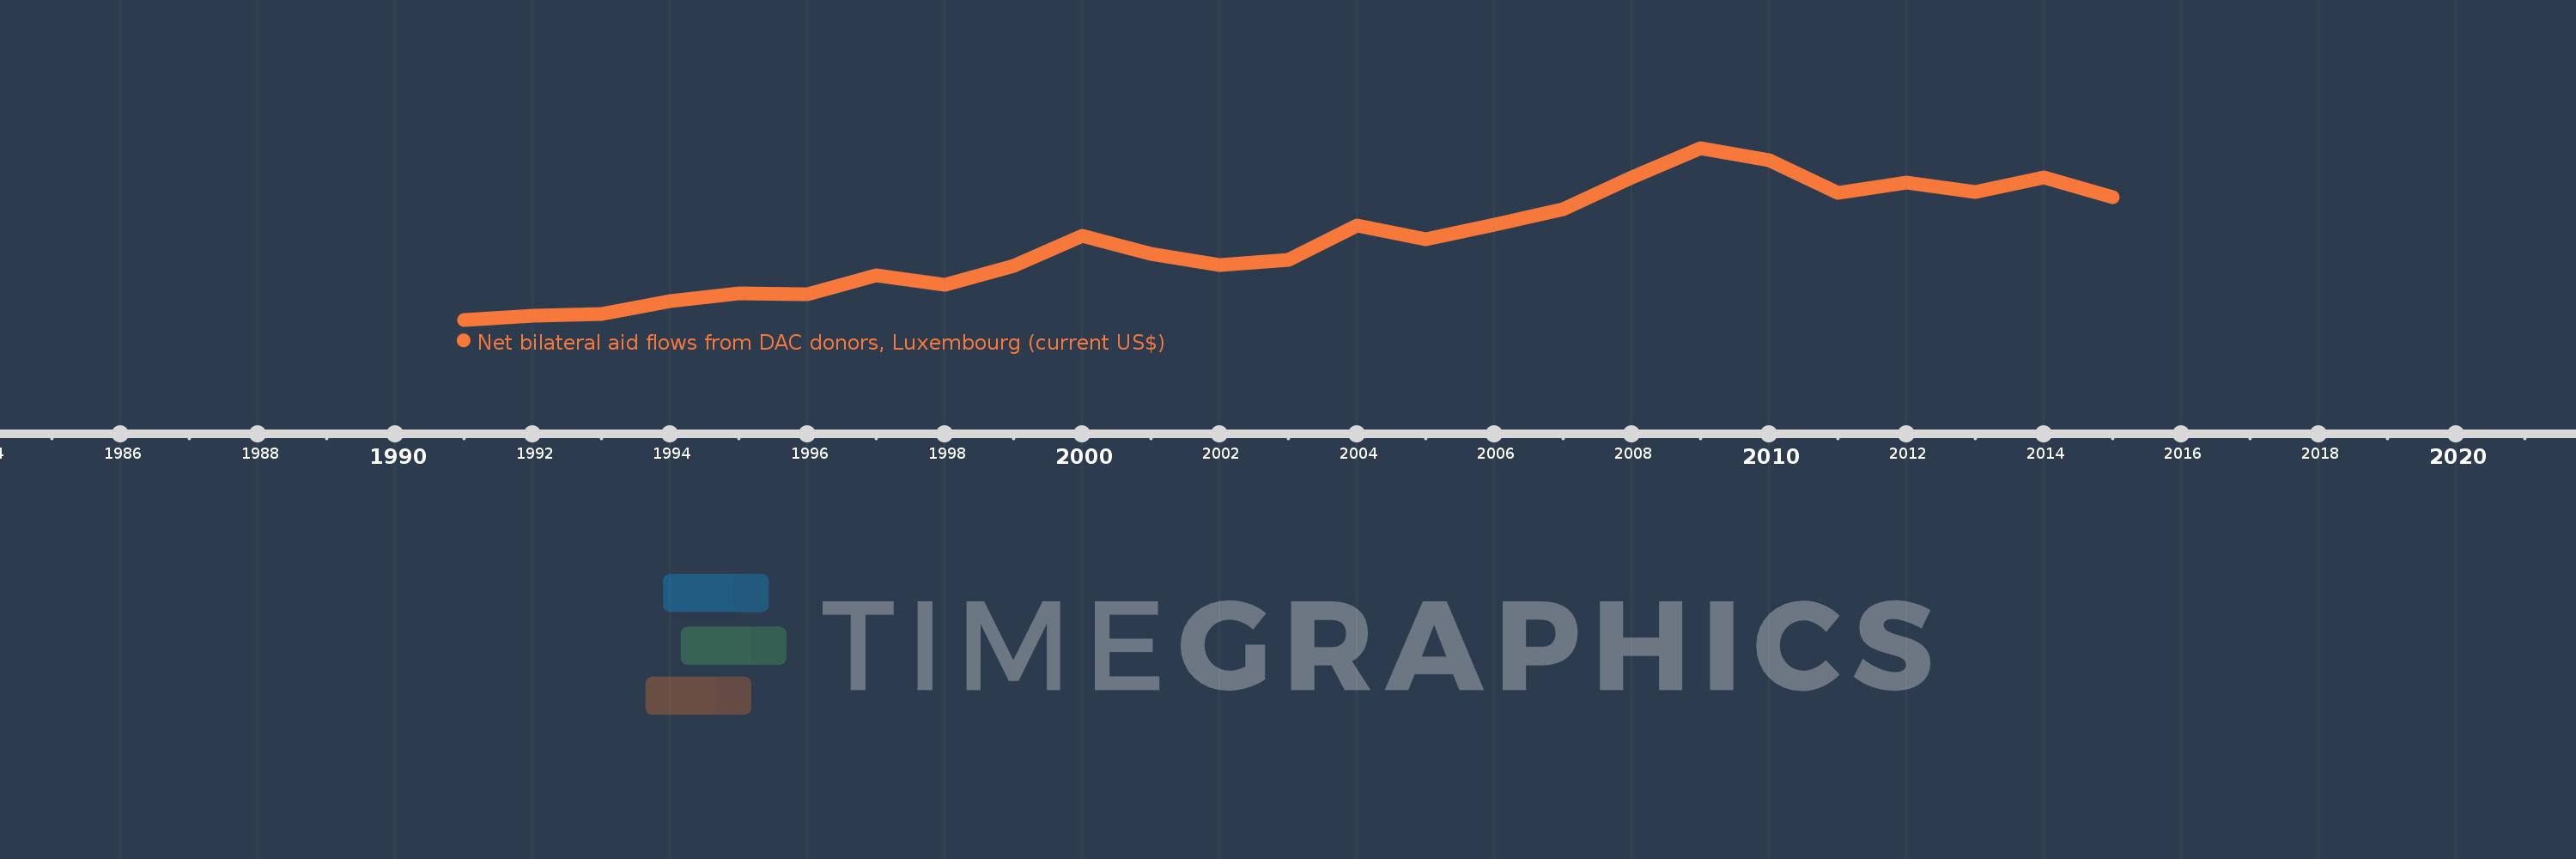
Net bilateral aid flows from DAC donors, Luxembourg (current US$)
2015,2014,2013,2012,2011,2010,2009,2008,2007,2006,2005,2004,2003,2002,2001,2000,1999,1998,1997,1996,1995,1994,1993,1992,1991
This statistics in other country:
AfghanistanAlbaniaAlgeriaAngolaArab WorldArgentinaArmeniaAzerbaijanBangladeshBelarusBelizeBeninBhutanBoliviaBosnia and HerzegovinaBotswanaBrazilBulgariaBurkina FasoBurundiCabo VerdeCambodiaCameroonCaribbean small statesCentral African RepublicCentral Europe and the BalticsChadChileChinaColombiaComorosCongo, Dem. Rep.Congo, Rep.Costa RicaCote d'IvoireCroatiaCubaCzech RepublicDjiboutiDominicaDominican RepublicEast Asia & PacificEast Asia & Pacific (excluding high income)East Asia & Pacific (IDA & IBRD countries)EcuadorEgypt, Arab Rep.El SalvadorEquatorial GuineaEritreaEstoniaEthiopiaEuro areaEurope & Central AsiaEurope & Central Asia (excluding high income)Europe & Central Asia (IDA & IBRD countries)European UnionFijiFragile and conflict affected situationsGabonGambia, TheGeorgiaGhanaGrenadaGuatemalaGuineaGuinea-BissauGuyanaHaitiHeavily indebted poor countries (HIPC)High incomeHondurasHungaryIBRD onlyIDA & IBRD totalIDA blendIDA onlyIDA totalIndiaIndonesiaIran, Islamic Rep.IraqIsraelJamaicaJordanKazakhstanKenyaKorea, Dem. People’s Rep.Korea, Rep.KosovoKyrgyz RepublicLao PDRLatin America & Caribbean Latin America & Caribbean (excluding high income)Latin America & the Caribbean (IDA & IBRD countries)LatviaLeast developed countries: UN classificationLebanonLesothoLiberiaLibyaLithuaniaLow & middle incomeLow incomeLower middle incomeMacedonia, FYRMadagascarMalawiMalaysiaMaldivesMaliMauritaniaMauritiusMexicoMicronesia, Fed. Sts.Middle East & North AfricaMiddle East & North Africa (excluding high income)Middle East & North Africa (IDA & IBRD countries)Middle incomeMoldovaMongoliaMontenegroMoroccoMozambiqueMyanmarNamibiaNepalNicaraguaNigerNigeriaOECD membersOther small statesPacific island small statesPakistanPalauPanamaParaguayPeruPhilippinesPolandRomaniaRussian FederationRwandaSamoaSao Tome and PrincipeSenegalSerbiaSierra LeoneSlovak RepublicSloveniaSmall statesSomaliaSouth AfricaSouth AsiaSouth Asia (IDA & IBRD)South SudanSri LankaSt. LuciaSub-Saharan Africa Sub-Saharan Africa (excluding high income)Sub-Saharan Africa (IDA & IBRD countries)SudanSwazilandSyrian Arab RepublicTajikistanTanzaniaThailandTimor-LesteTogoTunisiaTurkeyTurkmenistanUgandaUkraineUpper middle incomeUruguayUzbekistanVanuatuVenezuela, RBVietnamWest Bank and GazaWorldYemen, Rep.ZambiaZimbabwe Timeline:
This timeline shows a graph from 1991 to 2015 of Latin America & Caribbean . No data until 1990. Number of actual observations by date: 25.
Source name:
World Development Indicators
Source organization:
Development Assistance Committee of the Organisation for Economic Co-operation and Development, Geographical Distribution of Financial Flows to Developing Countries, Development Co-operation Report, and International Development Statistics database. Data are available online at: www.oecd.org/dac/stats/idsonline.
Categories, topics:
Aid Effectiveness
Last updated:
apr 23, 2017
Indicators value changes by year
Minimum:
2.19 mln
jan 1, 1991
Maximum:
41.46 mln
jan 1, 2009
At the date of observation
Value
Absolute change
Change from previous value
jan 1, 1991
2.19 mln
+2.19 mln
0.0%
jan 1, 1992
3.02 mln
+830.0K
37.9%
jan 1, 1993
3.55 mln
+530.0K
17.55%
jan 1, 1994
6.43 mln
+2.88 mln
81.13%
jan 1, 1995
8.28 mln
+1.85 mln
28.77%
jan 1, 1996
7.93 mln
-350.0K
-4.23%
jan 1, 1997
12.33 mln
+4.4 mln
55.49%
jan 1, 1998
10.15 mln
-2.18 mln
-17.68%
jan 1, 1999
14.57 mln
+4.42 mln
43.55%
jan 1, 2000
21.45 mln
+6.88 mln
47.22%
jan 1, 2001
17.17 mln
-4.28 mln
-19.95%
jan 1, 2002
14.67 mln
-2.5 mln
-14.56%
jan 1, 2003
15.97 mln
+1.3 mln
8.86%
jan 1, 2004
23.76 mln
+7.79 mln
48.78%
jan 1, 2005
20.63 mln
-3.13 mln
-13.17%
jan 1, 2006
23.84 mln
+3.21 mln
15.56%
jan 1, 2007
27.52 mln
+3.68 mln
15.44%
jan 1, 2008
34.71 mln
+7.19 mln
26.13%
jan 1, 2009
41.46 mln
+6.75 mln
19.45%
jan 1, 2010
38.59 mln
-2.87 mln
-6.92%
jan 1, 2011
31.15 mln
-7.44 mln
-19.28%
jan 1, 2012
33.51 mln
+2.36 mln
7.58%
jan 1, 2013
31.42 mln
-2.09 mln
-6.24%
jan 1, 2014
34.8 mln
+3.38 mln
10.76%
jan 1, 2015
30.19 mln
-4.61 mln
-13.25%
Ranking of countries by current statistics by years


Comments: