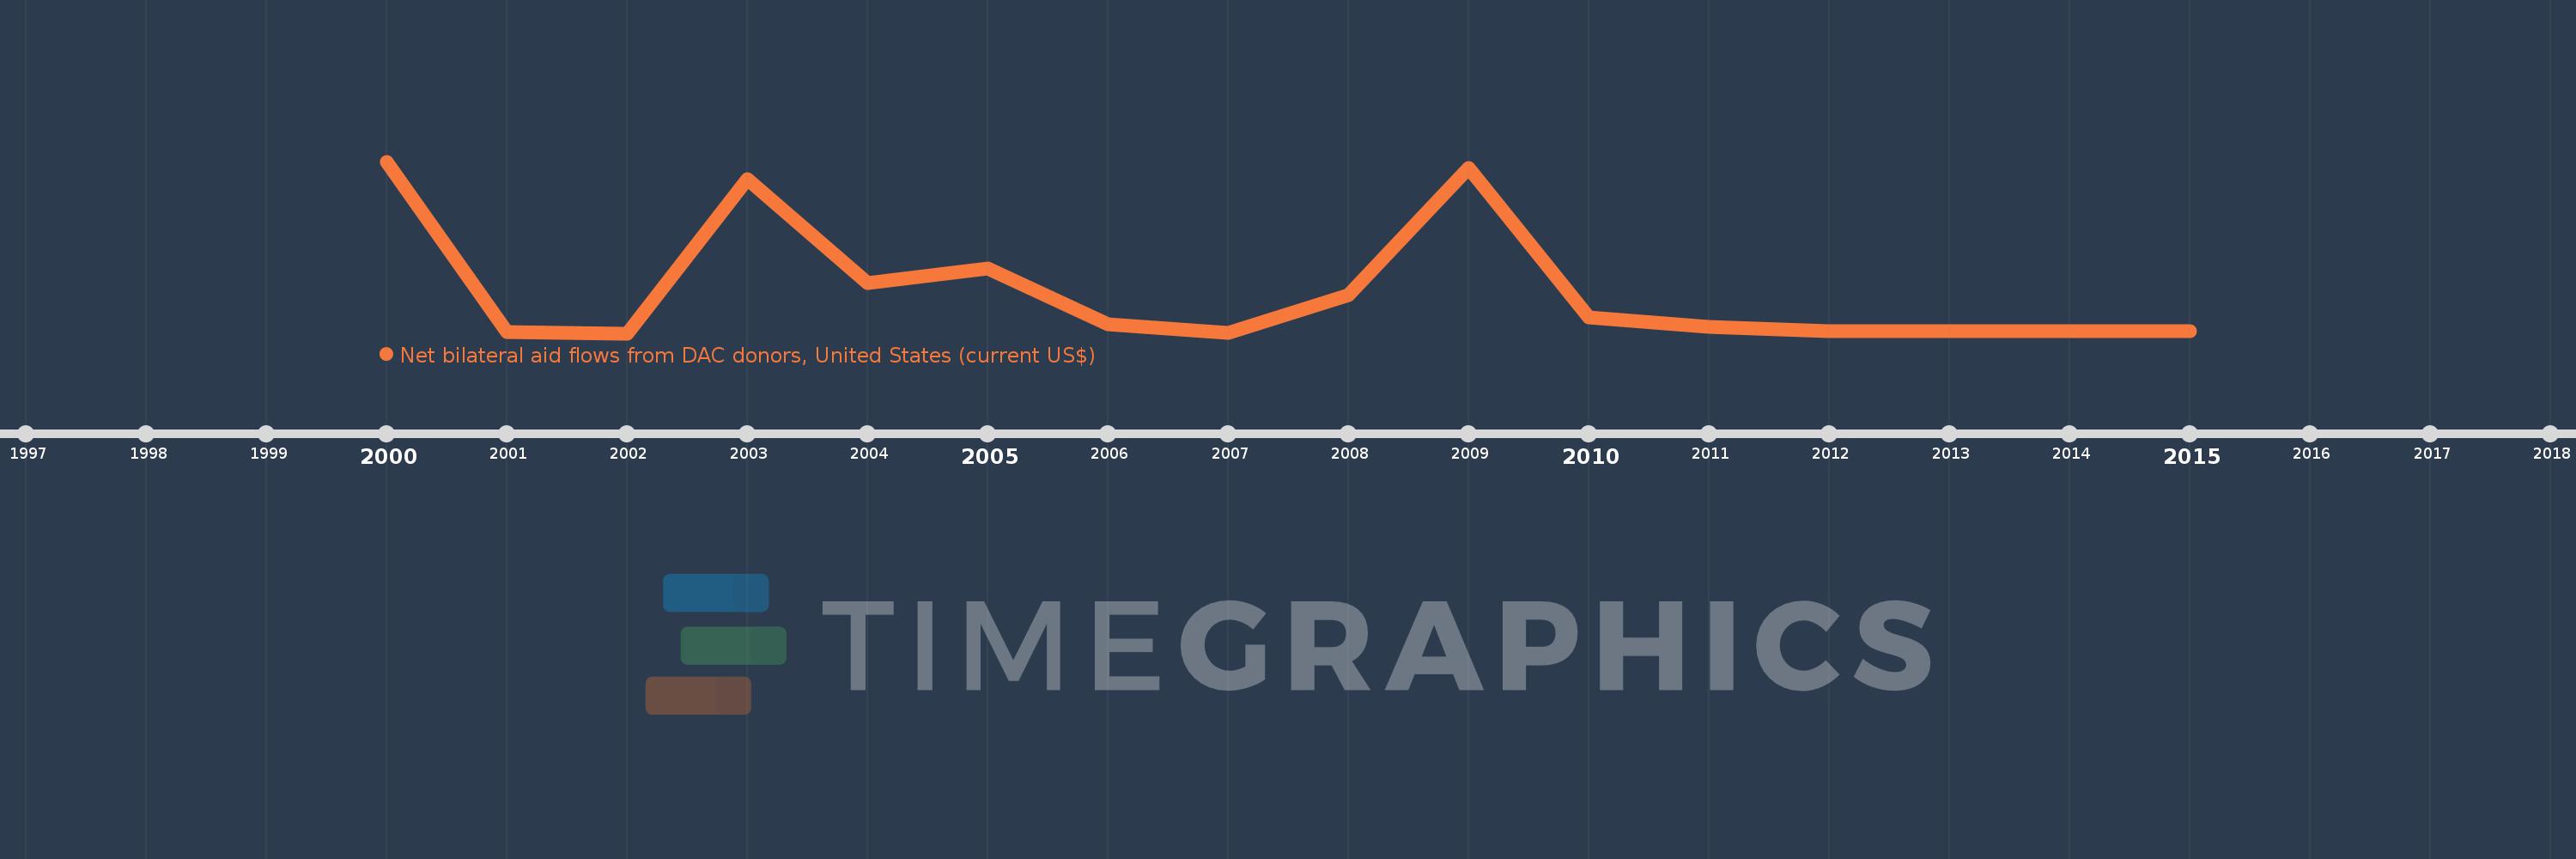
This timeline shows a graph from 2000 to 2015 of Korea, Dem. People’s Rep.. No data until 1999. Number of actual observations by date: 16.
Source name:
World Development Indicators
Source organization:
Development Assistance Committee of the Organisation for Economic Co-operation and Development, Geographical Distribution of Financial Flows to Developing Countries, Development Co-operation Report, and International Development Statistics database. Data are available online at: www.oecd.org/dac/stats/idsonline.
Categories, topics:
Aid Effectiveness
Last updated:
apr 23, 2017
Indicators value changes by year
Meaning:
36.691 mln
Minimum:
250.0K
jan 1, 2002
Maximum:
146.32 mln
jan 1, 2000
At the date of observation
Value
Absolute change
Change from the previous value
jan 1, 2000
146.32 mln
+146.32 mln
0.0%
jan 1, 2001
1.58 mln
-144.74 mln
-98.92%
jan 1, 2002
250.0K
-1.33 mln
-84.18%
jan 1, 2003
131.17 mln
+130.92 mln
52.37K%
jan 1, 2004
42.9 mln
-88.27 mln
-67.29%
jan 1, 2005
55.71 mln
+12.81 mln
29.86%
jan 1, 2006
7.91 mln
-47.8 mln
-85.8%
jan 1, 2007
400.0K
-7.51 mln
-94.94%
jan 1, 2008
32.51 mln
+32.11 mln
8.03K%
jan 1, 2009
141.04 mln
+108.53 mln
333.84%
jan 1, 2010
13.49 mln
-127.55 mln
-90.44%
jan 1, 2011
5.43 mln
-8.06 mln
-59.75%
jan 1, 2012
2.05 mln
-3.38 mln
-62.25%
jan 1, 2013
2.36 mln
+310.0K
15.12%
jan 1, 2014
1.87 mln
-490.0K
-20.76%
jan 1, 2015
2.06 mln
+190.0K
10.16%
Ranking of countries by current statistics by years
