29
/
en
AIzaSyAYiBZKx7MnpbEhh9jyipgxe19OcubqV5w
April 1, 2024
50281
Middle East & North Africa (IDA & IBRD countries)
TMN
false
2
1
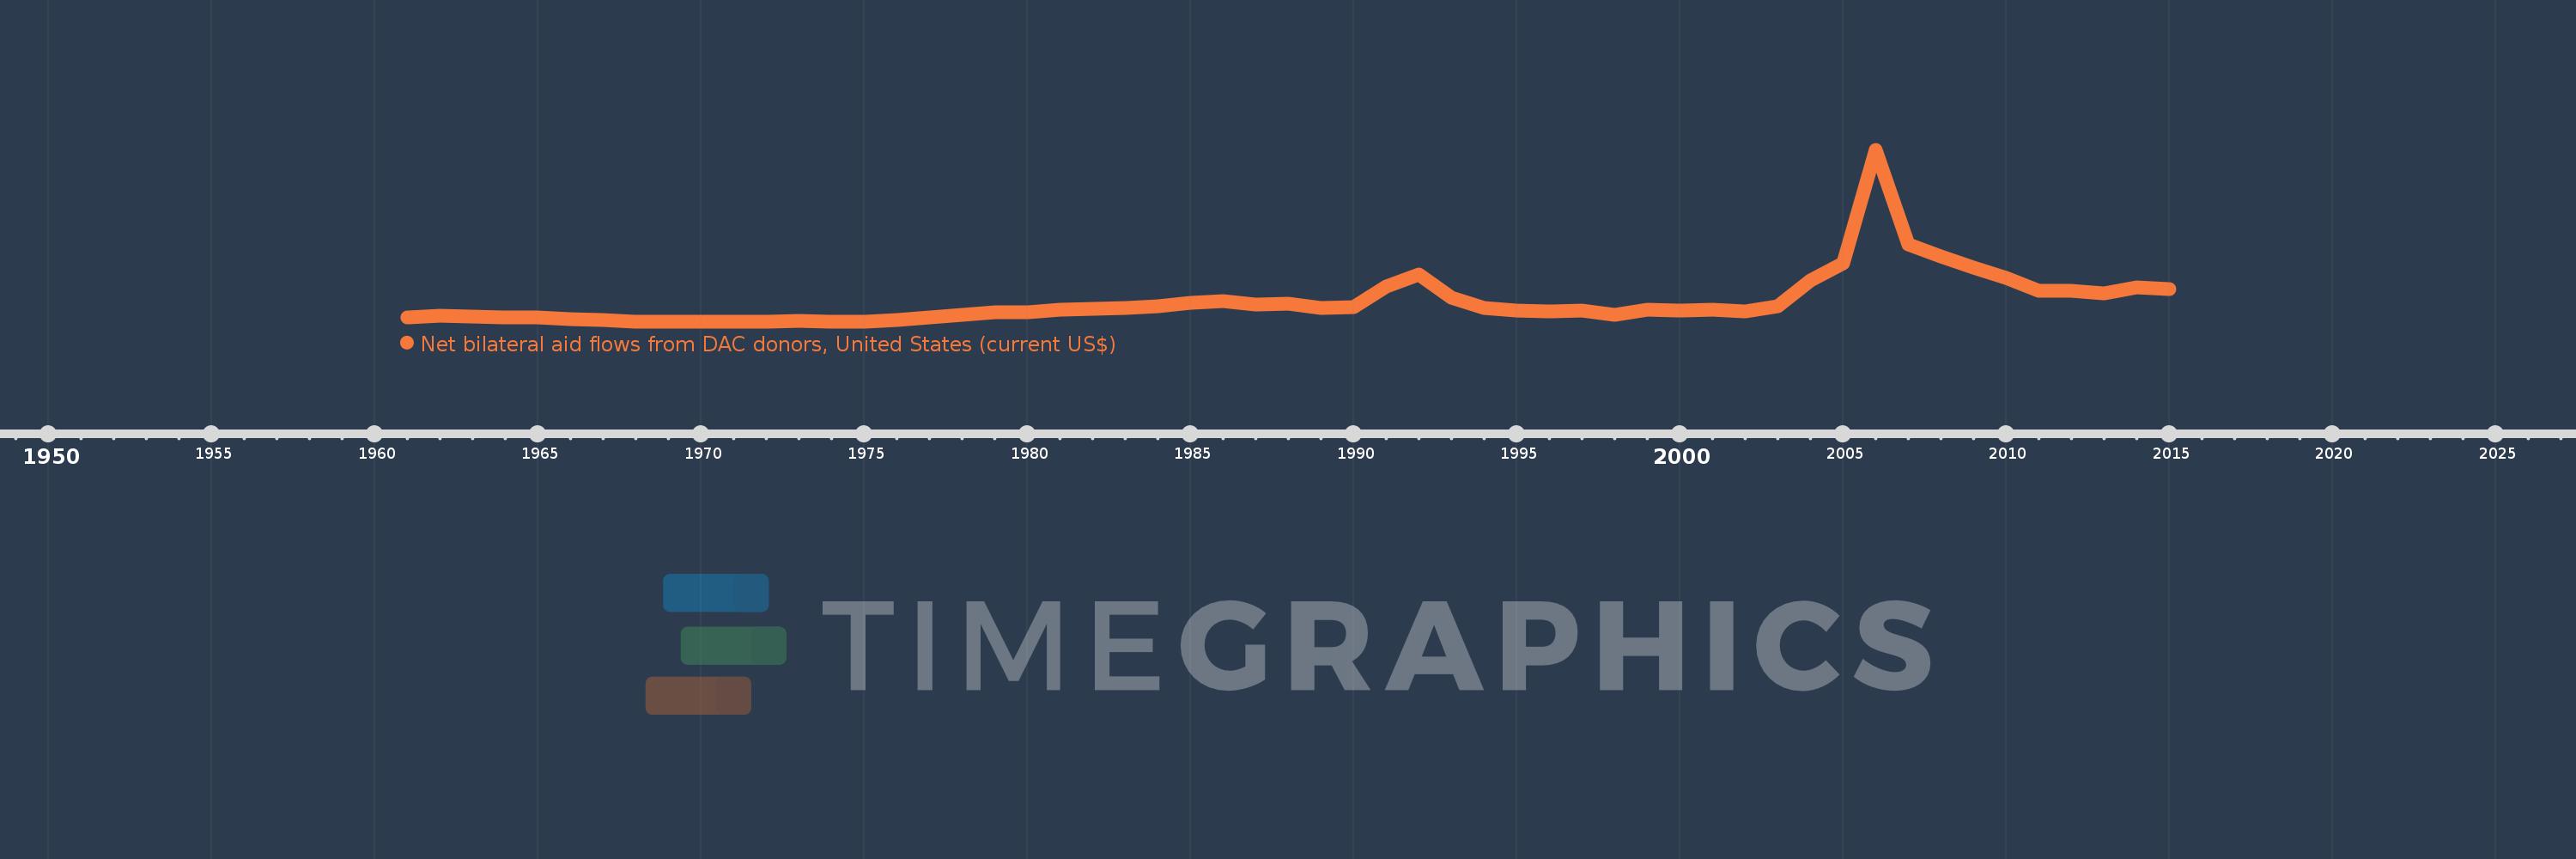
Net bilateral aid flows from DAC donors, United States (current US$)
2015,2014,2013,2012,2011,2010,2009,2008,2007,2006,2005,2004,2003,2002,2001,2000,1999,1998,1997,1996,1995,1994,1993,1992,1991,1990,1989,1988,1987,1986,1985,1984,1983,1982,1981,1980,1979,1978,1977,1976,1975,1974,1973,1972,1971,1970,1969,1968,1967,1966,1965,1964,1963,1962,1961
This statistics in other country:
AfghanistanAlbaniaAlgeriaAngolaAntigua and BarbudaArab WorldArgentinaArmeniaArubaAzerbaijanBahamas, TheBahrainBangladeshBarbadosBelarusBelizeBeninBermudaBhutanBoliviaBosnia and HerzegovinaBotswanaBrazilBritish Virgin IslandsBulgariaBurkina FasoBurundiCabo VerdeCambodiaCameroonCaribbean small statesCayman IslandsCentral African RepublicCentral Europe and the BalticsChadChileChinaColombiaComorosCongo, Dem. Rep.Congo, Rep.Costa RicaCote d'IvoireCroatiaCubaCyprusCzech RepublicDjiboutiDominicaDominican RepublicEast Asia & PacificEast Asia & Pacific (excluding high income)East Asia & Pacific (IDA & IBRD countries)EcuadorEgypt, Arab Rep.El SalvadorEquatorial GuineaEritreaEstoniaEthiopiaEuro areaEurope & Central AsiaEurope & Central Asia (excluding high income)Europe & Central Asia (IDA & IBRD countries)European UnionFijiFragile and conflict affected situationsGabonGambia, TheGeorgiaGhanaGrenadaGuatemalaGuineaGuinea-BissauGuyanaHaitiHeavily indebted poor countries (HIPC)High incomeHondurasHong Kong SAR, ChinaHungaryIBRD onlyIDA & IBRD totalIDA blendIDA onlyIDA totalIndiaIndonesiaIran, Islamic Rep.IraqIsraelJamaicaJordanKazakhstanKenyaKiribatiKorea, Dem. People’s Rep.Korea, Rep.KosovoKyrgyz RepublicLao PDRLatin America & Caribbean Latin America & Caribbean (excluding high income)Latin America & the Caribbean (IDA & IBRD countries)LatviaLeast developed countries: UN classificationLebanonLesothoLiberiaLibyaLithuaniaLow & middle incomeLow incomeLower middle incomeMacao SAR, ChinaMacedonia, FYRMadagascarMalawiMalaysiaMaldivesMaliMaltaMarshall IslandsMauritaniaMauritiusMexicoMicronesia, Fed. Sts.Middle East & North AfricaMiddle East & North Africa (excluding high income)Middle East & North Africa (IDA & IBRD countries)Middle incomeMoldovaMongoliaMontenegroMoroccoMozambiqueMyanmarNamibiaNepalNicaraguaNigerNigeriaNorth AmericaNorthern Mariana IslandsOECD membersOmanOther small statesPacific island small statesPakistanPalauPanamaPapua New GuineaParaguayPeruPhilippinesPolandQatarRomaniaRussian FederationRwandaSamoaSao Tome and PrincipeSaudi ArabiaSenegalSerbiaSeychellesSierra LeoneSingaporeSlovak RepublicSloveniaSmall statesSolomon IslandsSomaliaSouth AfricaSouth AsiaSouth Asia (IDA & IBRD)South SudanSri LankaSt. Kitts and NevisSt. LuciaSt. Vincent and the GrenadinesSub-Saharan Africa Sub-Saharan Africa (excluding high income)Sub-Saharan Africa (IDA & IBRD countries)SudanSurinameSwazilandSyrian Arab RepublicTajikistanTanzaniaThailandTimor-LesteTogoTongaTrinidad and TobagoTunisiaTurkeyTurkmenistanTurks and Caicos IslandsTuvaluUgandaUkraineUnited Arab EmiratesUpper middle incomeUruguayUzbekistanVanuatuVenezuela, RBVietnamWest Bank and GazaWorldYemen, Rep.ZambiaZimbabwe Timeline:
This timeline shows a graph from 1961 to 2015 of Middle East & North Africa (IDA & IBRD countries). No data until 1960. Number of actual observations by date: 55.
Source name:
World Development Indicators
Source organization:
Development Assistance Committee of the Organisation for Economic Co-operation and Development, Geographical Distribution of Financial Flows to Developing Countries, Development Co-operation Report, and International Development Statistics database. Data are available online at: www.oecd.org/dac/stats/idsonline.
Categories, topics:
Aid Effectiveness
Last updated:
apr 23, 2017
Indicators value changes by year
Minimum:
75.0 mln
jan 1, 1974
Maximum:
12.02 bln
jan 1, 2006
At the date of observation
Value
Absolute change
Change from previous value
jan 1, 1961
379.0 mln
+379.0 mln
0.0%
jan 1, 1962
532.0 mln
+153.0 mln
40.37%
jan 1, 1963
459.0 mln
-73.0 mln
-13.72%
jan 1, 1964
401.0 mln
-58.0 mln
-12.64%
jan 1, 1965
372.0 mln
-29.0 mln
-7.23%
jan 1, 1966
254.53 mln
-117.47 mln
-31.58%
jan 1, 1967
212.9 mln
-41.63 mln
-16.36%
jan 1, 1968
111.85 mln
-101.05 mln
-47.46%
jan 1, 1969
98.67 mln
-13.18 mln
-11.78%
jan 1, 1970
87.0 mln
-11.67 mln
-11.83%
jan 1, 1971
84.0 mln
-3.0 mln
-3.45%
jan 1, 1972
118.0 mln
+34.0 mln
40.48%
jan 1, 1973
132.0 mln
+14.0 mln
11.86%
jan 1, 1974
75.0 mln
-57.0 mln
-43.18%
jan 1, 1975
118.0 mln
+43.0 mln
57.33%
jan 1, 1976
187.0 mln
+69.0 mln
58.47%
jan 1, 1977
366.0 mln
+179.0 mln
95.72%
jan 1, 1978
582.0 mln
+216.0 mln
59.02%
jan 1, 1979
771.0 mln
+189.0 mln
32.47%
jan 1, 1980
772.0 mln
+1000.0K
0.13%
jan 1, 1981
951.0 mln
+179.0 mln
23.19%
jan 1, 1982
1.004 bln
+53.0 mln
5.57%
jan 1, 1983
1.054 bln
+50.0 mln
4.98%
jan 1, 1984
1.153 bln
+99.0 mln
9.39%
jan 1, 1985
1.413 bln
+260.0 mln
22.55%
jan 1, 1986
1.543 bln
+130.0 mln
9.2%
jan 1, 1987
1.306 bln
-237.0 mln
-15.36%
jan 1, 1988
1.329 bln
+23.0 mln
1.76%
jan 1, 1989
1.02 bln
-309.0 mln
-23.25%
jan 1, 1990
1.136 bln
+116.0 mln
11.37%
jan 1, 1991
2.551 bln
+1.415 bln
124.56%
jan 1, 1992
3.394 bln
+843.0 mln
33.05%
jan 1, 1993
1.783 bln
-1.611 bln
-47.47%
jan 1, 1994
1.033 bln
-750.0 mln
-42.06%
jan 1, 1995
844.0 mln
-189.0 mln
-18.3%
jan 1, 1996
837.0 mln
-7.0 mln
-0.83%
jan 1, 1997
842.0 mln
+5.0 mln
0.6%
jan 1, 1998
564.0 mln
-278.0 mln
-33.02%
jan 1, 1999
922.67 mln
+358.67 mln
63.59%
jan 1, 2000
860.45 mln
-62.22 mln
-6.74%
jan 1, 2001
906.45 mln
+46.0 mln
5.35%
jan 1, 2002
830.99 mln
-75.46 mln
-8.32%
jan 1, 2003
1.167 bln
+336.15 mln
40.45%
jan 1, 2004
2.973 bln
+1.806 bln
154.7%
jan 1, 2005
4.161 bln
+1.189 bln
39.98%
jan 1, 2006
12.02 bln
+7.859 bln
188.85%
jan 1, 2007
5.45 bln
-6.57 bln
-54.66%
jan 1, 2008
4.634 bln
-816.28 mln
-14.98%
jan 1, 2009
3.88 bln
-753.25 mln
-16.26%
jan 1, 2010
3.155 bln
-725.42 mln
-18.7%
jan 1, 2011
2.236 bln
-918.39 mln
-29.11%
jan 1, 2012
2.249 bln
+12.35 mln
0.55%
jan 1, 2013
2.065 bln
-183.92 mln
-8.18%
jan 1, 2014
2.473 bln
+408.59 mln
19.79%
jan 1, 2015
2.351 bln
-122.01 mln
-4.93%
Ranking of countries by current statistics by years


Comments: