30
/
AIzaSyAYiBZKx7MnpbEhh9jyipgxe19OcubqV5w
April 1, 2024
165369
Jordan
JOR
true
2
1
PPG, bonds (TDS, current US$)
2016,2015,2014,2013,2012,2011,2010,2009,2008,2007,2006,2005,2004,2003,2002,2001,2000,1999,1998,1997,1996,1995,1993,1992,1991
Public Timelines
FAQ
Menu
Public Timelines
FAQ
For education
For educational institutions
For teachers
For students
Open cabinet
Create
Close
Create a timeline
Public timelines
Library
FAQ
Download
Global statistics library
→
Jordan
→
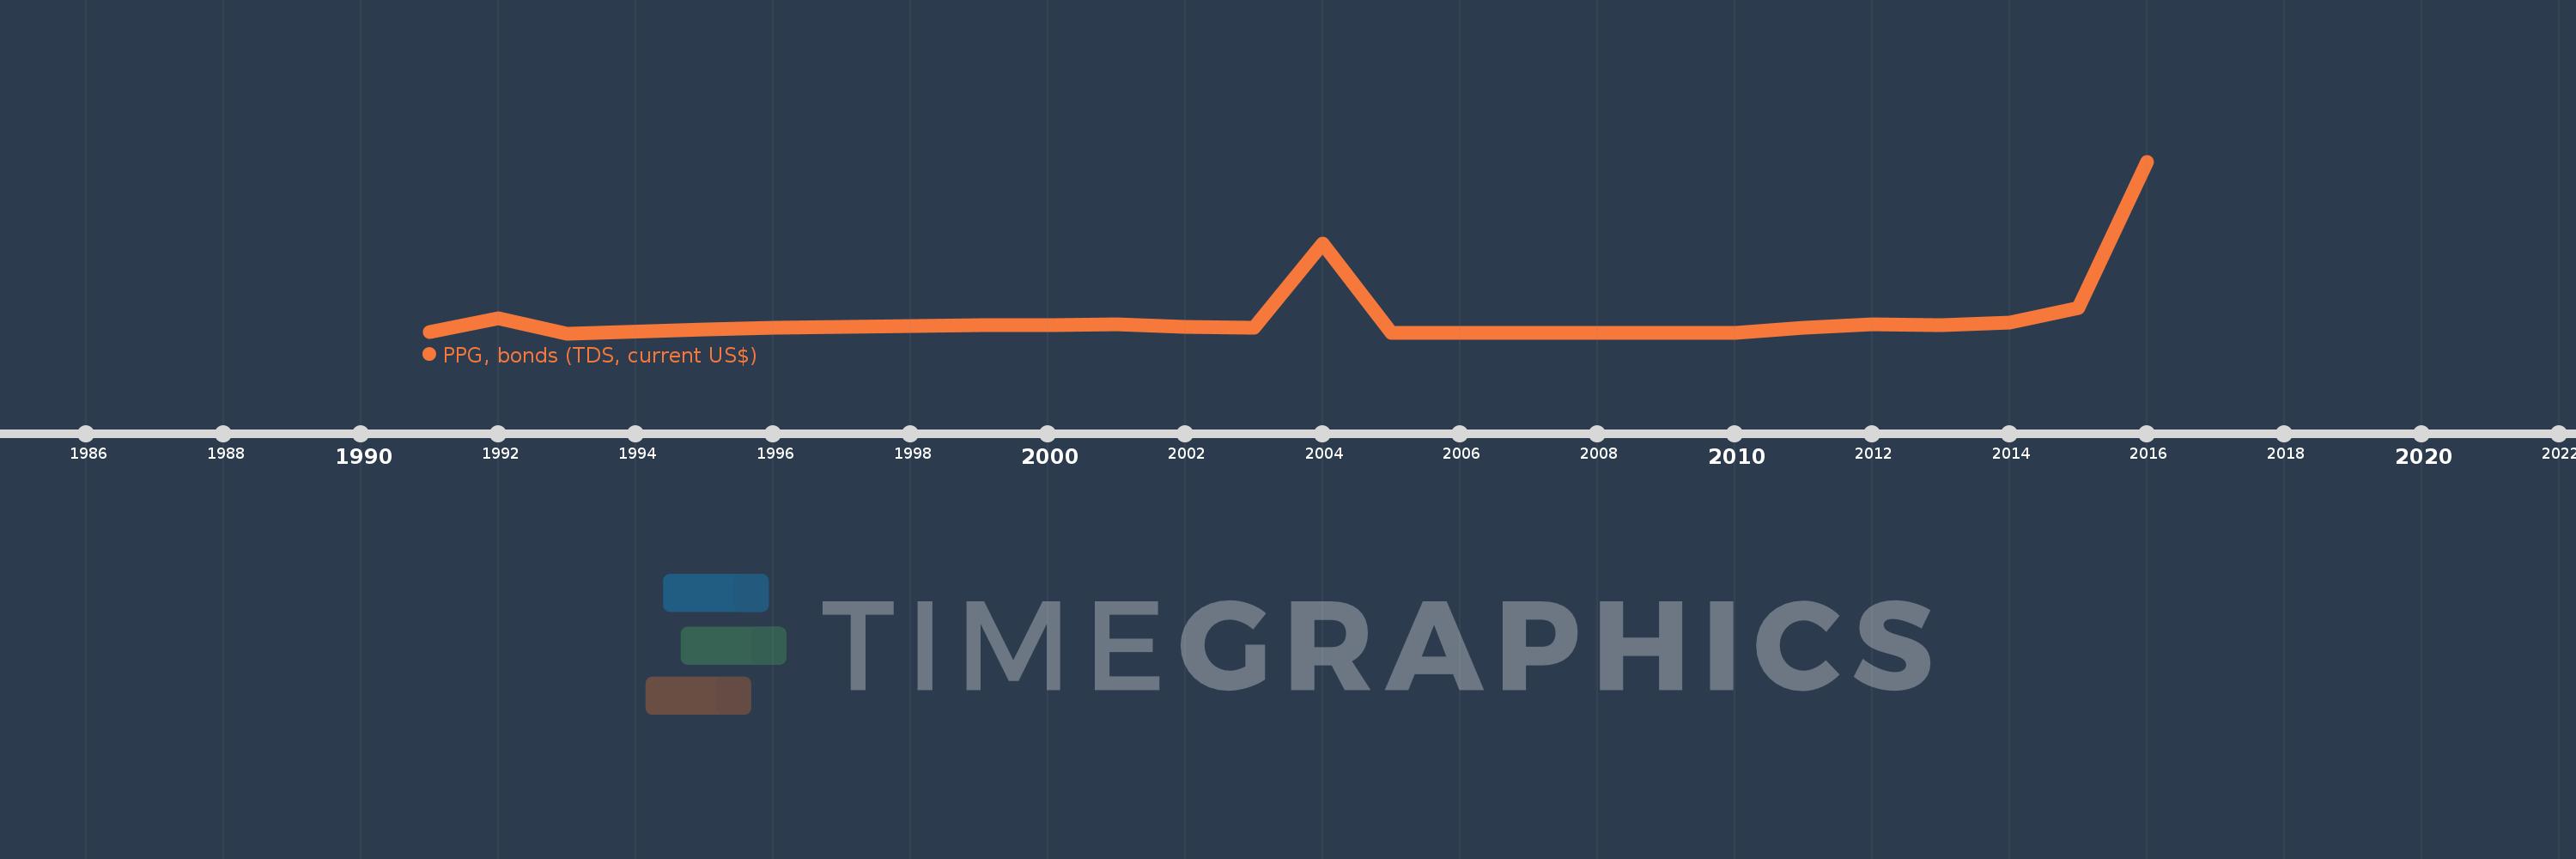
PPG, bonds (TDS, current US$)
This statistics in other country:
Albania
Algeria
Angola
Argentina
Armenia
Azerbaijan
Belarus
Belize
Benin
Bolivia
Bosnia and Herzegovina
Botswana
Brazil
Bulgaria
Burkina Faso
Cameroon
China
Colombia
Congo, Dem. Rep.
Congo, Rep.
Costa Rica
Cote d'Ivoire
Dominica
Dominican Republic
East Asia & Pacific (excluding high income)
Ecuador
Egypt, Arab Rep.
El Salvador
Ethiopia
Europe & Central Asia (excluding high income)
Fiji
Gabon
Georgia
Ghana
Grenada
Guatemala
Guinea
Guyana
Honduras
IDA only
India
Indonesia
Jamaica
Jordan
Kazakhstan
Kenya
Lao PDR
Latin America & Caribbean (excluding high income)
Lebanon
Low & middle income
Low income
Lower middle income
Macedonia, FYR
Malawi
Malaysia
Mauritania
Mauritius
Mexico
Middle East & North Africa (excluding high income)
Middle income
Moldova
Mongolia
Montenegro
Morocco
Mozambique
Nicaragua
Niger
Nigeria
Pakistan
Panama
Papua New Guinea
Paraguay
Peru
Philippines
Romania
Russian Federation
Rwanda
Samoa
Senegal
Serbia
Sierra Leone
South Africa
South Asia
Sri Lanka
St. Lucia
St. Vincent and the Grenadines
Sub-Saharan Africa (excluding high income)
Sudan
Thailand
Togo
Tunisia
Turkey
Uganda
Ukraine
Upper middle income
Venezuela, RB
Vietnam
Zambia
Zimbabwe
Timeline:
This timeline shows a graph from
1991
to
2016
of Jordan. No data until
1990
. Number of actual observations by date:
25
.
Source name:
World Development Indicators
Source organization:
World Bank, International Debt Statistics.
Categories, topics:
External Debt
Last updated:
apr 23, 2017
Indicators value changes by year
Meaning:
92.228 mln
Minimum:
5.936 mln
jan 1, 1993
Maximum:
931.405 mln
jan 1, 2016
At the date of observation
Value
Absolute change
Change from the previous value
jan 1, 1991
13.326 mln
+13.326 mln
0.0%
jan 1, 1992
85.826 mln
+72.5 mln
544.05%
jan 1, 1993
5.936 mln
-79.89 mln
-93.08%
jan 1, 1995
27.43 mln
+21.494 mln
362.1%
jan 1, 1996
37.706 mln
+10.276 mln
37.46%
jan 1, 1997
41.101 mln
+3.395 mln
9.0%
jan 1, 1998
45.779 mln
+4.678 mln
11.38%
jan 1, 1999
49.732 mln
+3.953 mln
8.63%
jan 1, 2000
50.916 mln
+1.184 mln
2.38%
jan 1, 2001
52.553 mln
+1.637 mln
3.22%
jan 1, 2002
41.038 mln
-11.515 mln
-21.91%
jan 1, 2003
34.316 mln
-6.722 mln
-16.38%
jan 1, 2004
488.809 mln
+454.493 mln
1.32K%
jan 1, 2005
10.265 mln
-478.544 mln
-97.9%
jan 1, 2006
10.152 mln
-113.0K
-1.1%
jan 1, 2007
8.903 mln
-1.249 mln
-12.3%
jan 1, 2008
8.903 mln
0.0
0.0%
jan 1, 2009
8.903 mln
0.0
0.0%
jan 1, 2010
8.903 mln
0.0
0.0%
jan 1, 2011
33.986 mln
+25.083 mln
281.74%
jan 1, 2012
53.053 mln
+19.067 mln
56.1%
jan 1, 2013
51.646 mln
-1.407 mln
-2.65%
jan 1, 2014
62.05 mln
+10.404 mln
20.14%
jan 1, 2015
143.073 mln
+81.023 mln
130.58%
jan 1, 2016
931.405 mln
+788.332 mln
551.0%
Ranking of countries by current statistics by years
About & Feedback
Terms
Privacy
Library
2024
©
Time.Graphics
Support 24/7
Cabinet
Get premium
Donate
The service accepts bank transfer (ACH, Wire) or cards (Visa, MasterCard, etc). Processed by Stripe.
Secured with SSL
Excellent (Trustpilot Reviews)
Based on 115+ reviews
Write your own review on
Trustpilot.com
