29
/
en
AIzaSyAYiBZKx7MnpbEhh9jyipgxe19OcubqV5w
April 1, 2024
231567
Rwanda
RWA
true
2
1
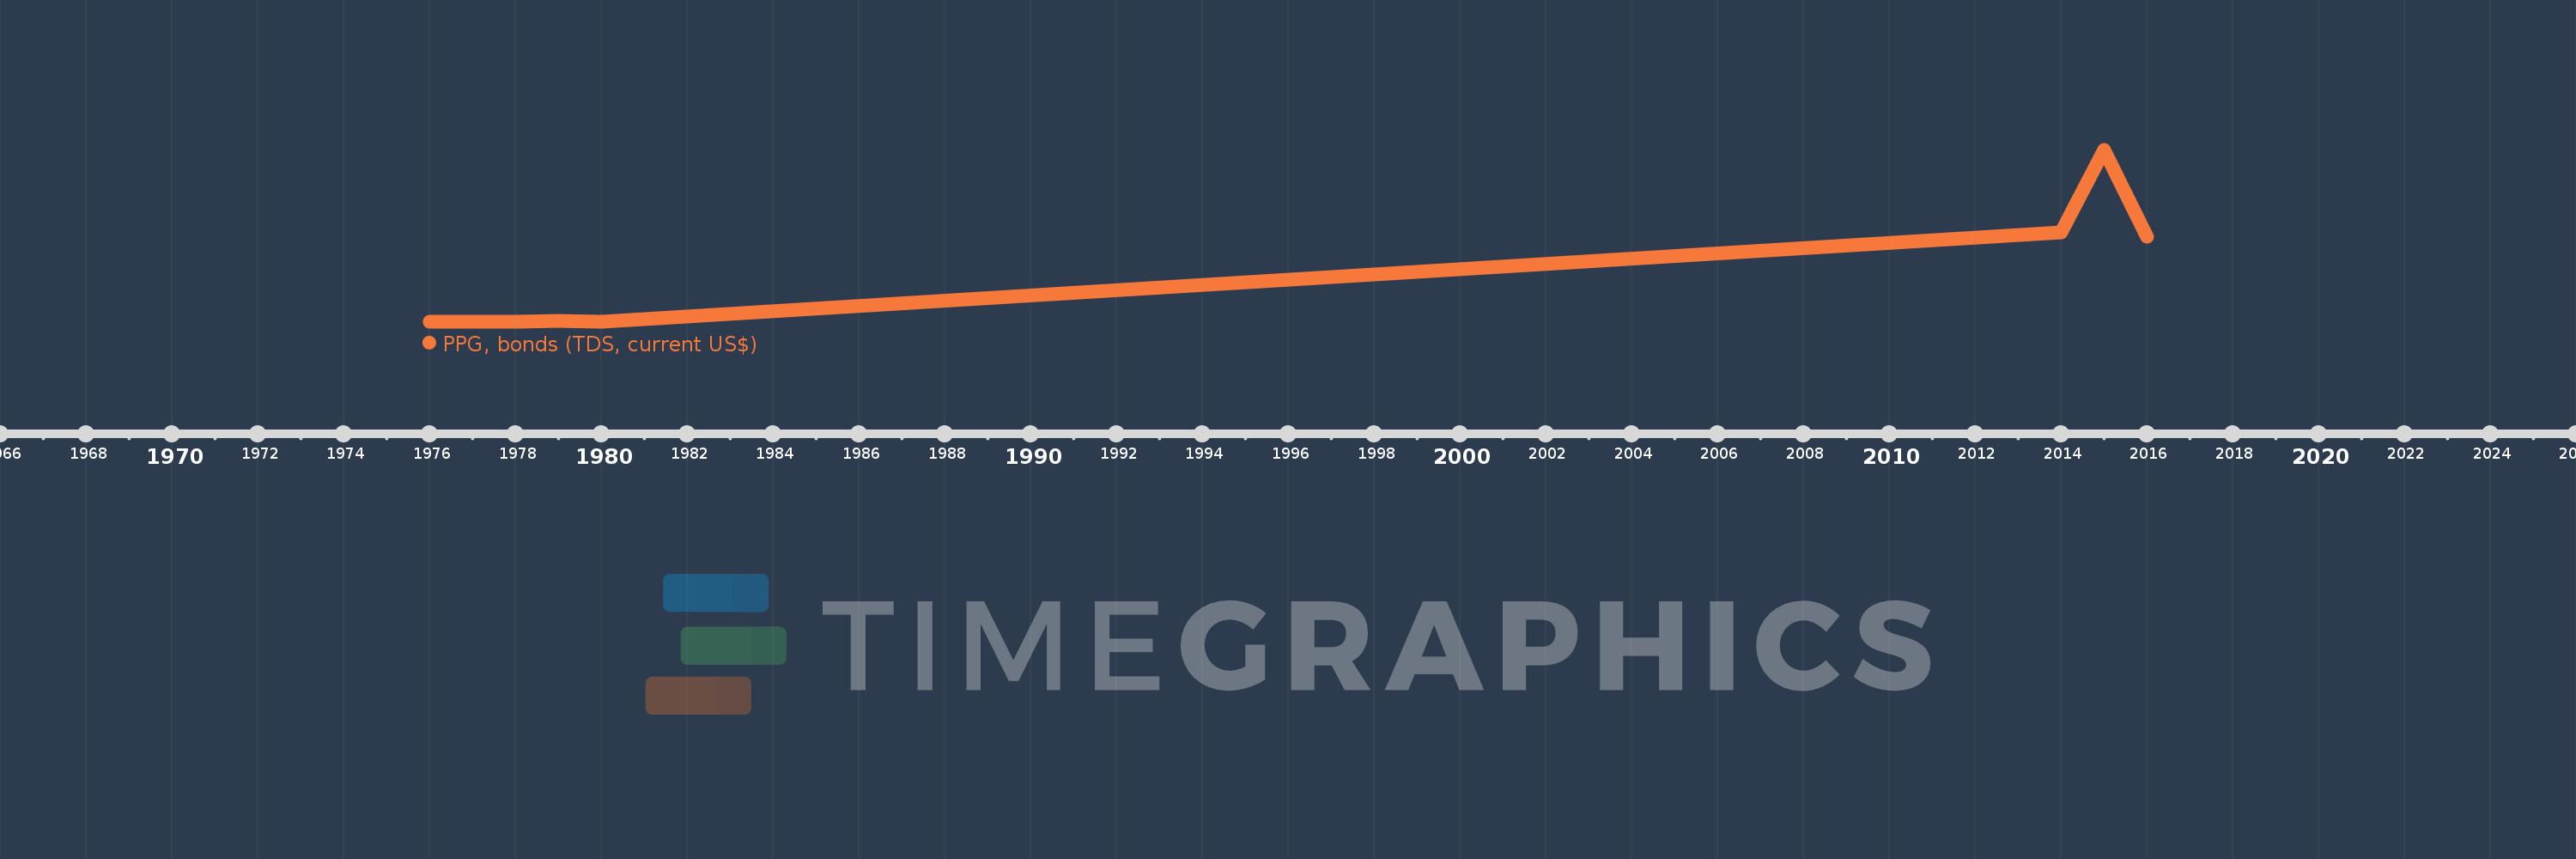
PPG, bonds (TDS, current US$)
2016,2015,2014,1980,1979,1978,1977,1976
This statistics in other country:
Timeline:
This timeline shows a graph from 1976 to 2016 of Rwanda. No data until 1975. Number of actual observations by date: 8.
Source name:
World Development Indicators
Source organization:
World Bank, International Debt Statistics.
Categories, topics:
External Debt
Last updated:
apr 23, 2017
Indicators value changes by year
Maximum:
26.5 mln
jan 1, 2015
At the date of observation
Value
Absolute change
Change from previous value
jan 1, 1976
120.0K
+120.0K
0.0%
jan 1, 1977
108.0K
-12.0K
-10.0%
jan 1, 1978
96.0K
-12.0K
-11.11%
jan 1, 1979
267.0K
+171.0K
178.13%
jan 1, 1980
145.0K
-122.0K
-45.69%
jan 1, 2014
13.85 mln
+13.705 mln
9.45K%
jan 1, 2015
26.5 mln
+12.65 mln
91.34%
jan 1, 2016
13.25 mln
-13.25 mln
-50.0%
Ranking of countries by current statistics by years


Comments: