29
/
en
AIzaSyAYiBZKx7MnpbEhh9jyipgxe19OcubqV5w
April 1, 2024
151169
Honduras
HND
true
2
1
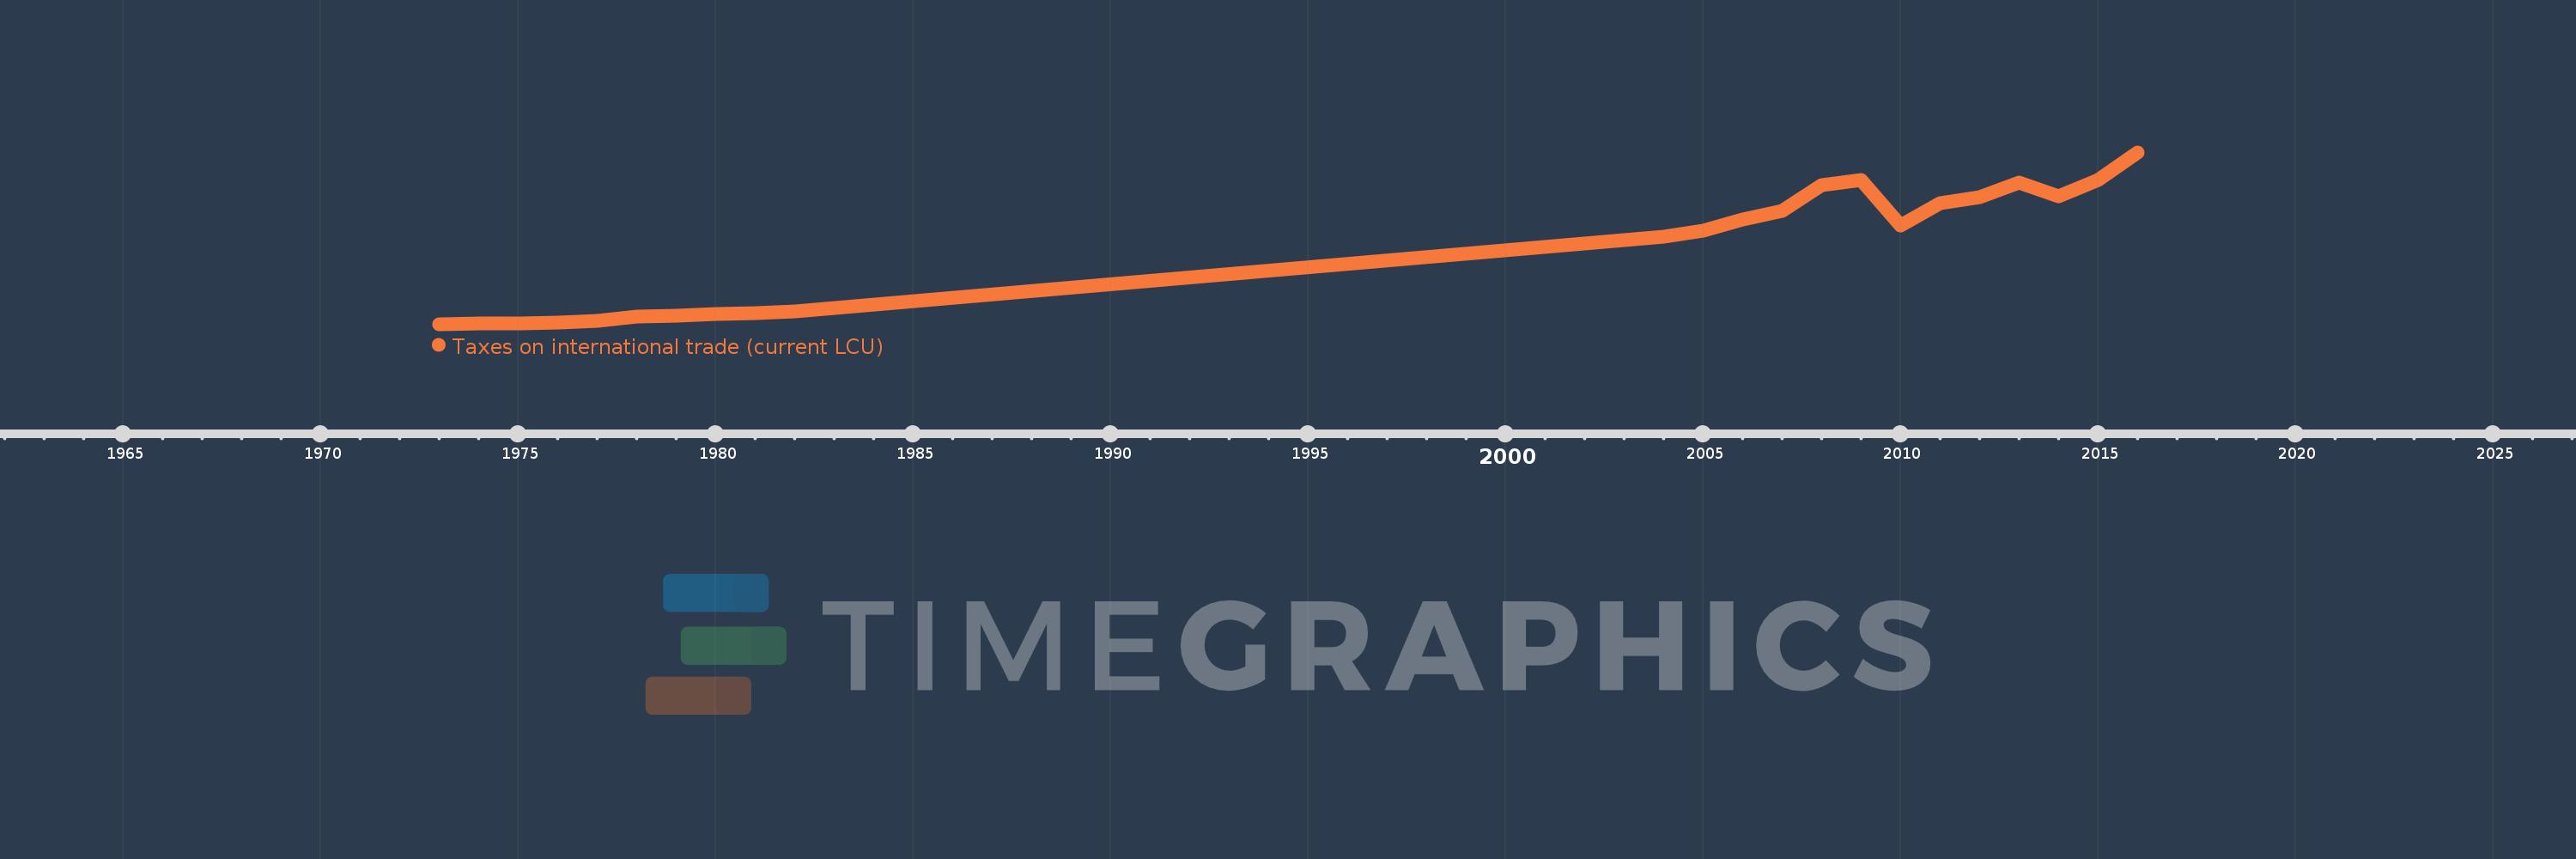
Taxes on international trade (current LCU)
2016,2015,2014,2013,2012,2011,2010,2009,2008,2007,2006,2005,2004,1982,1981,1980,1979,1978,1977,1976,1975,1974,1973
This statistics in other country:
AfghanistanAlbaniaAlgeriaAngolaAntigua and BarbudaArgentinaArmeniaAustraliaAustriaAzerbaijanBahamas, TheBahrainBangladeshBarbadosBelarusBelizeBeninBhutanBoliviaBosnia and HerzegovinaBotswanaBrazilBulgariaBurkina FasoBurundiCabo VerdeCambodiaCanadaCentral African RepublicChileChinaColombiaCongo, Dem. Rep.Congo, Rep.Costa RicaCote d'IvoireCroatiaCyprusCzech RepublicDenmarkDominicaDominican RepublicEgypt, Arab Rep.El SalvadorEquatorial GuineaEstoniaEthiopiaFijiFinlandFranceGambia, TheGeorgiaGermanyGhanaGreeceGrenadaGuatemalaHondurasHong Kong SAR, ChinaHungaryIcelandIndiaIndonesiaIran, Islamic Rep.IraqIrelandIsraelItalyJamaicaJapanJordanKazakhstanKenyaKiribatiKorea, Rep.KuwaitKyrgyz RepublicLao PDRLatviaLebanonLesothoLiberiaLithuaniaLuxembourgMacedonia, FYRMadagascarMalawiMalaysiaMaldivesMaliMaltaMauritiusMexicoMicronesia, Fed. Sts.MoldovaMongoliaMoroccoMozambiqueMyanmarNamibiaNepalNetherlandsNew ZealandNicaraguaNorwayOmanPakistanPanamaPapua New GuineaParaguayPeruPhilippinesPolandPortugalQatarRomaniaRussian FederationRwandaSamoaSan MarinoSao Tome and PrincipeSenegalSerbiaSeychellesSierra LeoneSingaporeSlovak RepublicSloveniaSolomon IslandsSouth AfricaSpainSri LankaSt. Kitts and NevisSt. LuciaSurinameSwazilandSwedenSwitzerlandSyrian Arab RepublicTajikistanTanzaniaThailandTimor-LesteTogoTrinidad and TobagoTunisiaTurkeyUgandaUkraineUnited Arab EmiratesUnited KingdomUnited StatesUruguayVanuatuVenezuela, RBVietnamWest Bank and GazaYemen, Rep.ZambiaZimbabwe Timeline:
This timeline shows a graph from 1973 to 2016 of Honduras. No data until 1972. Number of actual observations by date: 23.
Source name:
World Development Indicators
Source organization:
International Monetary Fund, Government Finance Statistics Yearbook and data files.
Categories, topics:
Public Sector
Last updated:
apr 23, 2017
Indicators value changes by year
Minimum:
57.8 mln
jan 1, 1973
Maximum:
3.541 bln
jan 1, 2016
At the date of observation
Value
Absolute change
Change from previous value
jan 1, 1973
57.8 mln
+57.8 mln
0.0%
jan 1, 1974
67.8 mln
+10.0 mln
17.3%
jan 1, 1975
79.9 mln
+12.1 mln
17.85%
jan 1, 1976
84.2 mln
+4.3 mln
5.38%
jan 1, 1977
130.4 mln
+46.2 mln
54.87%
jan 1, 1978
210.6 mln
+80.2 mln
61.5%
jan 1, 1979
224.4 mln
+13.8 mln
6.55%
jan 1, 1980
257.3 mln
+32.9 mln
14.66%
jan 1, 1981
278.3 mln
+21.0 mln
8.16%
jan 1, 1982
314.4 mln
+36.1 mln
12.97%
jan 1, 2004
1.833 bln
+1.518 bln
482.89%
jan 1, 2005
1.952 bln
+119.0 mln
6.49%
jan 1, 2006
2.178 bln
+226.8 mln
11.62%
jan 1, 2007
2.353 bln
+174.5 mln
8.01%
jan 1, 2008
2.879 bln
+525.962 mln
22.35%
jan 1, 2009
2.975 bln
+96.238 mln
3.34%
jan 1, 2010
2.065 bln
-910.0 mln
-30.59%
jan 1, 2011
2.505 bln
+440.0 mln
21.31%
jan 1, 2012
2.626 bln
+121.1 mln
4.83%
jan 1, 2013
2.933 bln
+306.3 mln
11.66%
jan 1, 2014
2.651 bln
-281.385 mln
-9.6%
jan 1, 2015
2.974 bln
+322.743 mln
12.17%
jan 1, 2016
3.541 bln
+567.196 mln
19.07%
Ranking of countries by current statistics by years


Comments: