29
/
en
AIzaSyAYiBZKx7MnpbEhh9jyipgxe19OcubqV5w
April 1, 2024
274363
Ukraine
UKR
true
2
1
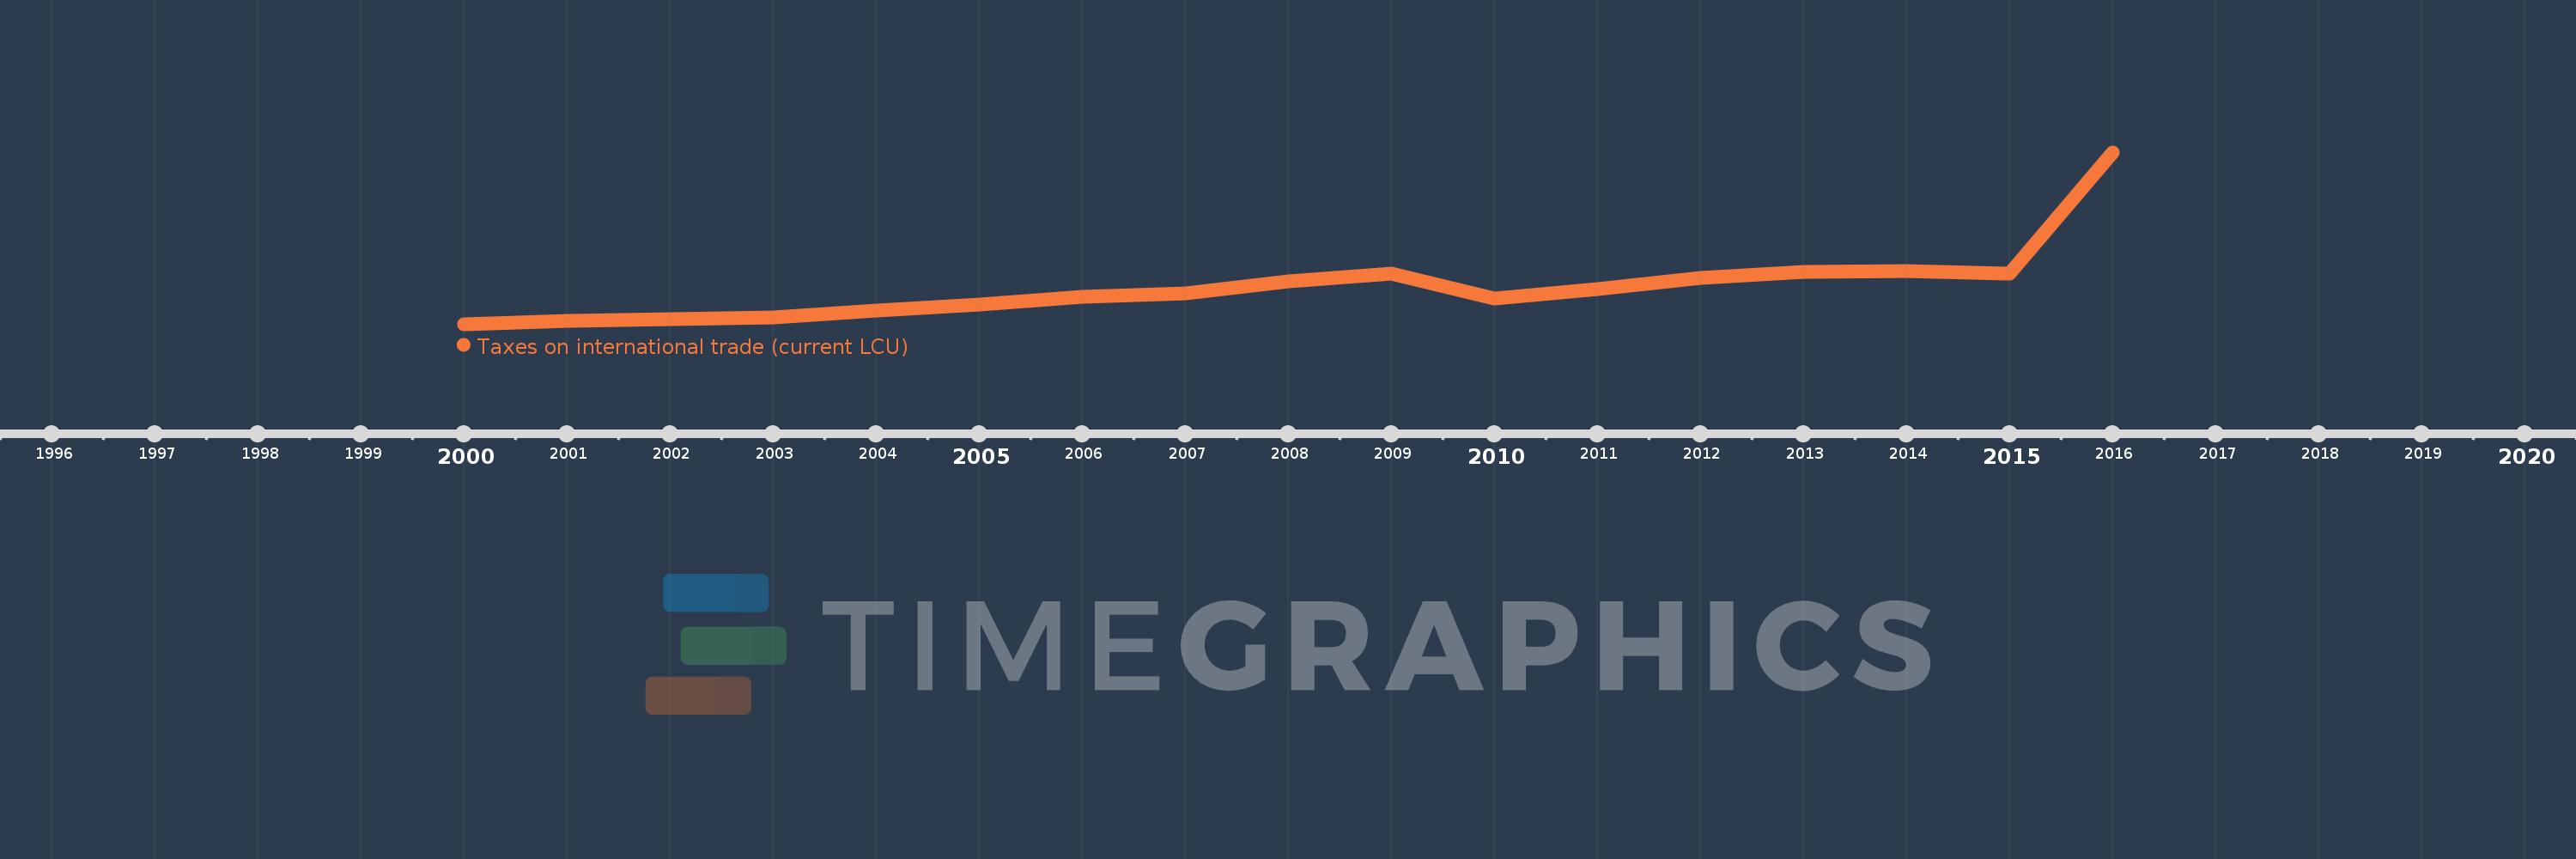
Taxes on international trade (current LCU)
2016,2015,2014,2013,2012,2011,2010,2009,2008,2007,2006,2005,2004,2003,2002,2001,2000
This statistics in other country:
AfghanistanAlbaniaAlgeriaAngolaAntigua and BarbudaArgentinaArmeniaAustraliaAustriaAzerbaijanBahamas, TheBahrainBangladeshBarbadosBelarusBelizeBeninBhutanBoliviaBosnia and HerzegovinaBotswanaBrazilBulgariaBurkina FasoBurundiCabo VerdeCambodiaCanadaCentral African RepublicChileChinaColombiaCongo, Dem. Rep.Congo, Rep.Costa RicaCote d'IvoireCroatiaCyprusCzech RepublicDenmarkDominicaDominican RepublicEgypt, Arab Rep.El SalvadorEquatorial GuineaEstoniaEthiopiaFijiFinlandFranceGambia, TheGeorgiaGermanyGhanaGreeceGrenadaGuatemalaHondurasHong Kong SAR, ChinaHungaryIcelandIndiaIndonesiaIran, Islamic Rep.IraqIrelandIsraelItalyJamaicaJapanJordanKazakhstanKenyaKiribatiKorea, Rep.KuwaitKyrgyz RepublicLao PDRLatviaLebanonLesothoLiberiaLithuaniaLuxembourgMacedonia, FYRMadagascarMalawiMalaysiaMaldivesMaliMaltaMauritiusMexicoMicronesia, Fed. Sts.MoldovaMongoliaMoroccoMozambiqueMyanmarNamibiaNepalNetherlandsNew ZealandNicaraguaNorwayOmanPakistanPanamaPapua New GuineaParaguayPeruPhilippinesPolandPortugalQatarRomaniaRussian FederationRwandaSamoaSan MarinoSao Tome and PrincipeSenegalSerbiaSeychellesSierra LeoneSingaporeSlovak RepublicSloveniaSolomon IslandsSouth AfricaSpainSri LankaSt. Kitts and NevisSt. LuciaSurinameSwazilandSwedenSwitzerlandSyrian Arab RepublicTajikistanTanzaniaThailandTimor-LesteTogoTrinidad and TobagoTunisiaTurkeyUgandaUkraineUnited Arab EmiratesUnited KingdomUnited StatesUruguayVanuatuVenezuela, RBVietnamWest Bank and GazaYemen, Rep.ZambiaZimbabwe Timeline:
This timeline shows a graph from 2000 to 2016 of Ukraine. No data until 1999. Number of actual observations by date: 17.
Source name:
World Development Indicators
Source organization:
International Monetary Fund, Government Finance Statistics Yearbook and data files.
Categories, topics:
Public Sector
Last updated:
apr 23, 2017
Indicators value changes by year
Minimum:
1.263 bln
jan 1, 2000
Maximum:
40.908 bln
jan 1, 2016
At the date of observation
Value
Absolute change
Change from previous value
jan 1, 2000
1.263 bln
+1.263 bln
0.0%
jan 1, 2001
1.947 bln
+684.3 mln
54.19%
jan 1, 2002
2.422 bln
+475.0 mln
24.4%
jan 1, 2003
2.881 bln
+458.546 mln
18.93%
jan 1, 2004
4.463 bln
+1.582 bln
54.93%
jan 1, 2005
5.892 bln
+1.43 bln
32.03%
jan 1, 2006
7.671 bln
+1.779 bln
30.19%
jan 1, 2007
8.46 bln
+788.3 mln
10.28%
jan 1, 2008
11.21 bln
+2.751 bln
32.51%
jan 1, 2009
12.999 bln
+1.789 bln
15.96%
jan 1, 2010
7.138 bln
-5.861 bln
-45.09%
jan 1, 2011
9.289 bln
+2.151 bln
30.14%
jan 1, 2012
12.009 bln
+2.72 bln
29.28%
jan 1, 2013
13.401 bln
+1.393 bln
11.6%
jan 1, 2014
13.561 bln
+160.307 mln
1.2%
jan 1, 2015
12.855 bln
-706.107 mln
-5.21%
jan 1, 2016
40.908 bln
+28.053 bln
218.22%
Ranking of countries by current statistics by years


Comments: