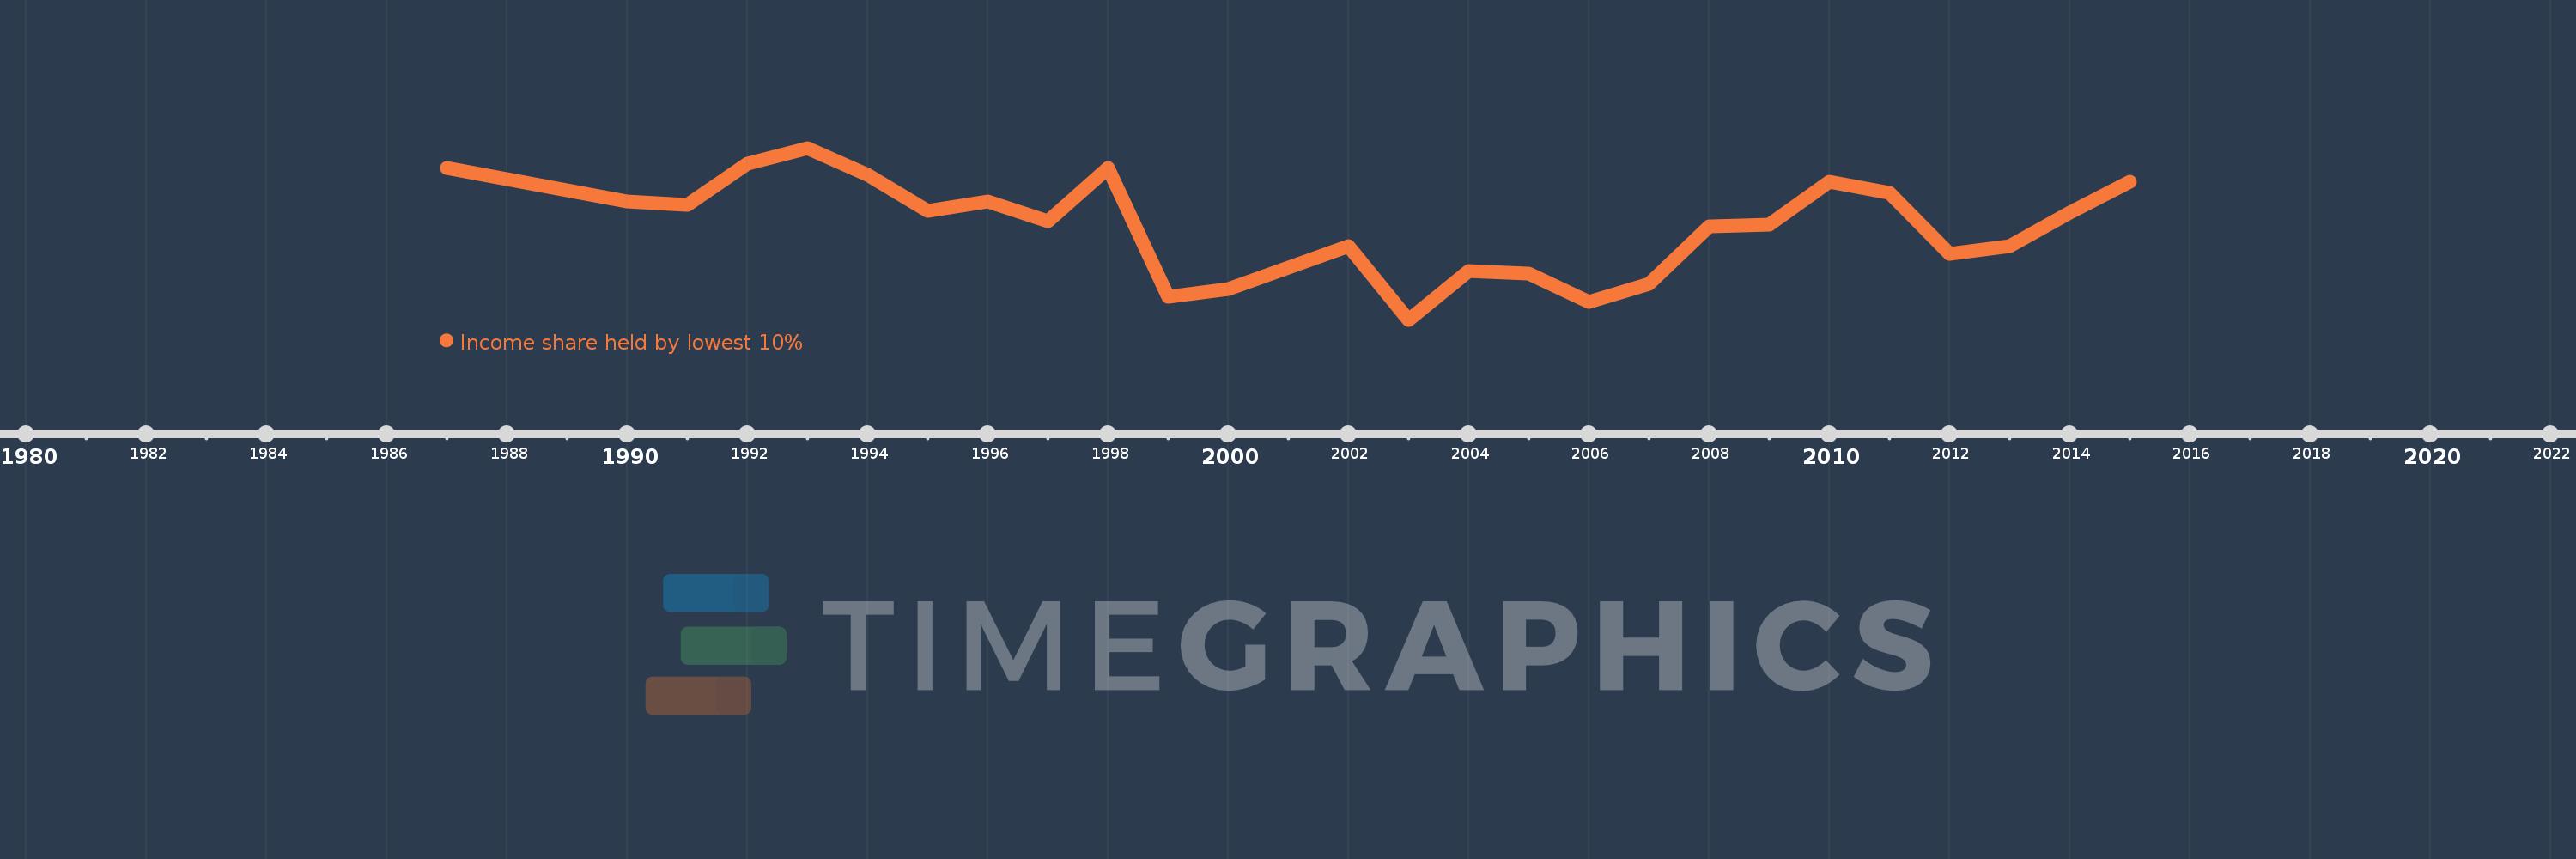
This timeline shows a graph from 1987 to 2015 of Honduras. No data until 1986. Number of actual observations by date: 26.
Source name:
World Development Indicators
Source organization:
World Bank, Development Research Group. Data are based on primary household survey data obtained from government statistical agencies and World Bank country departments. Data for high-income economies are from the Luxembourg Income Study database. For more information and methodology, please see PovcalNet (http://iresearch.worldbank.org/PovcalNet/index.htm).
Categories, topics:
Poverty
Last updated:
apr 23, 2017
Indicators value changes by year
Meaning:
0.906
Minimum:
0.38
jan 1, 2003
Maximum:
1.34
jan 1, 1993
At the date of observation
Value
Absolute change
Change from the previous value
jan 1, 1987
1.23
+1.23
0.0%
jan 1, 1990
1.04
-0.19
-15.45%
jan 1, 1991
1.02
-0.02
-1.92%
jan 1, 1992
1.25
+0.23
22.55%
jan 1, 1993
1.34
+0.09
7.2%
jan 1, 1994
1.19
-0.15
-11.19%
jan 1, 1995
0.99
-0.2
-16.81%
jan 1, 1996
1.04
+0.05
5.05%
jan 1, 1997
0.93
-0.11
-10.58%
jan 1, 1998
1.23
+0.3
32.26%
jan 1, 1999
0.51
-0.72
-58.54%
jan 1, 2000
0.55
+0.04
7.84%
jan 1, 2002
0.79
+0.24
43.64%
jan 1, 2003
0.38
-0.41
-51.9%
jan 1, 2004
0.65
+0.27
71.05%
jan 1, 2005
0.64
-0.01
-1.54%
jan 1, 2006
0.48
-0.16
-25.0%
jan 1, 2007
0.58
+0.1
20.83%
jan 1, 2008
0.9
+0.32
55.17%
jan 1, 2009
0.91
+0.01
1.11%
jan 1, 2010
1.15
+0.24
26.37%
jan 1, 2011
1.09
-0.06
-5.22%
jan 1, 2012
0.75
-0.34
-31.19%
jan 1, 2013
0.79
+0.04
5.33%
jan 1, 2014
0.98
+0.19
24.05%
jan 1, 2015
1.15
+0.17
17.35%
Ranking of countries by current statistics by years
