29
/
en
AIzaSyAYiBZKx7MnpbEhh9jyipgxe19OcubqV5w
April 1, 2024
211847
Niger
NER
true
2
1
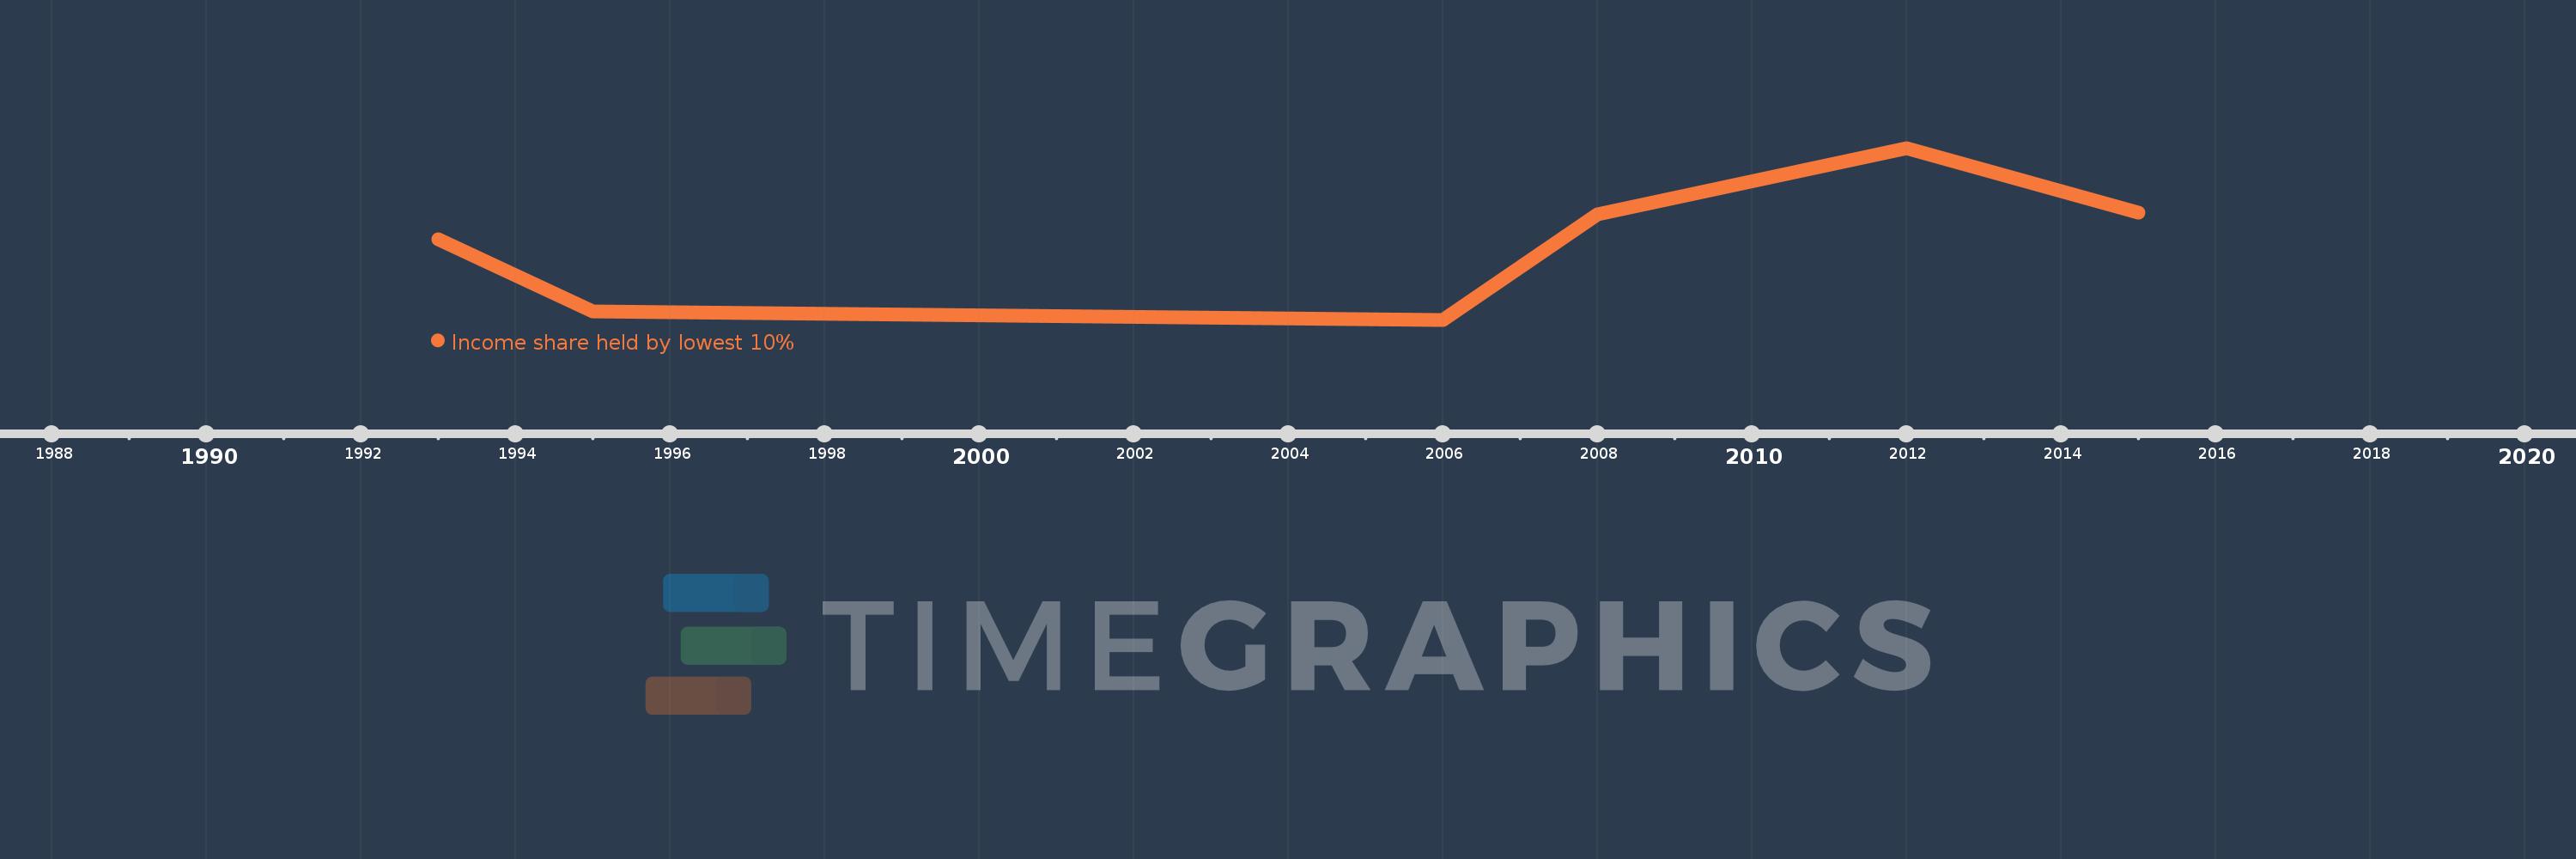
Income share held by lowest 10%
2015,2012,2008,2006,1995,1993
This statistics in other country:
Timeline:
This timeline shows a graph from 1993 to 2015 of Niger. No data until 1992. Number of actual observations by date: 6.
Source name:
World Development Indicators
Source organization:
World Bank, Development Research Group. Data are based on primary household survey data obtained from government statistical agencies and World Bank country departments. Data for high-income economies are from the Luxembourg Income Study database. For more information and methodology, please see PovcalNet (http://iresearch.worldbank.org/PovcalNet/index.htm).
Categories, topics:
Poverty
Last updated:
apr 23, 2017
Indicators value changes by year
At the date of observation
Value
Absolute change
Change from previous value
jan 1, 1995
2.36
-0.64
-21.33%
jan 1, 2006
2.29
-0.07
-2.97%
jan 1, 2008
3.22
+0.93
40.61%
jan 1, 2012
3.8
+0.58
18.01%
jan 1, 2015
3.23
-0.57
-15.0%
Ranking of countries by current statistics by years


Comments: