29
/
en
AIzaSyAYiBZKx7MnpbEhh9jyipgxe19OcubqV5w
April 1, 2024
149501
Haiti
HTI
true
2
1
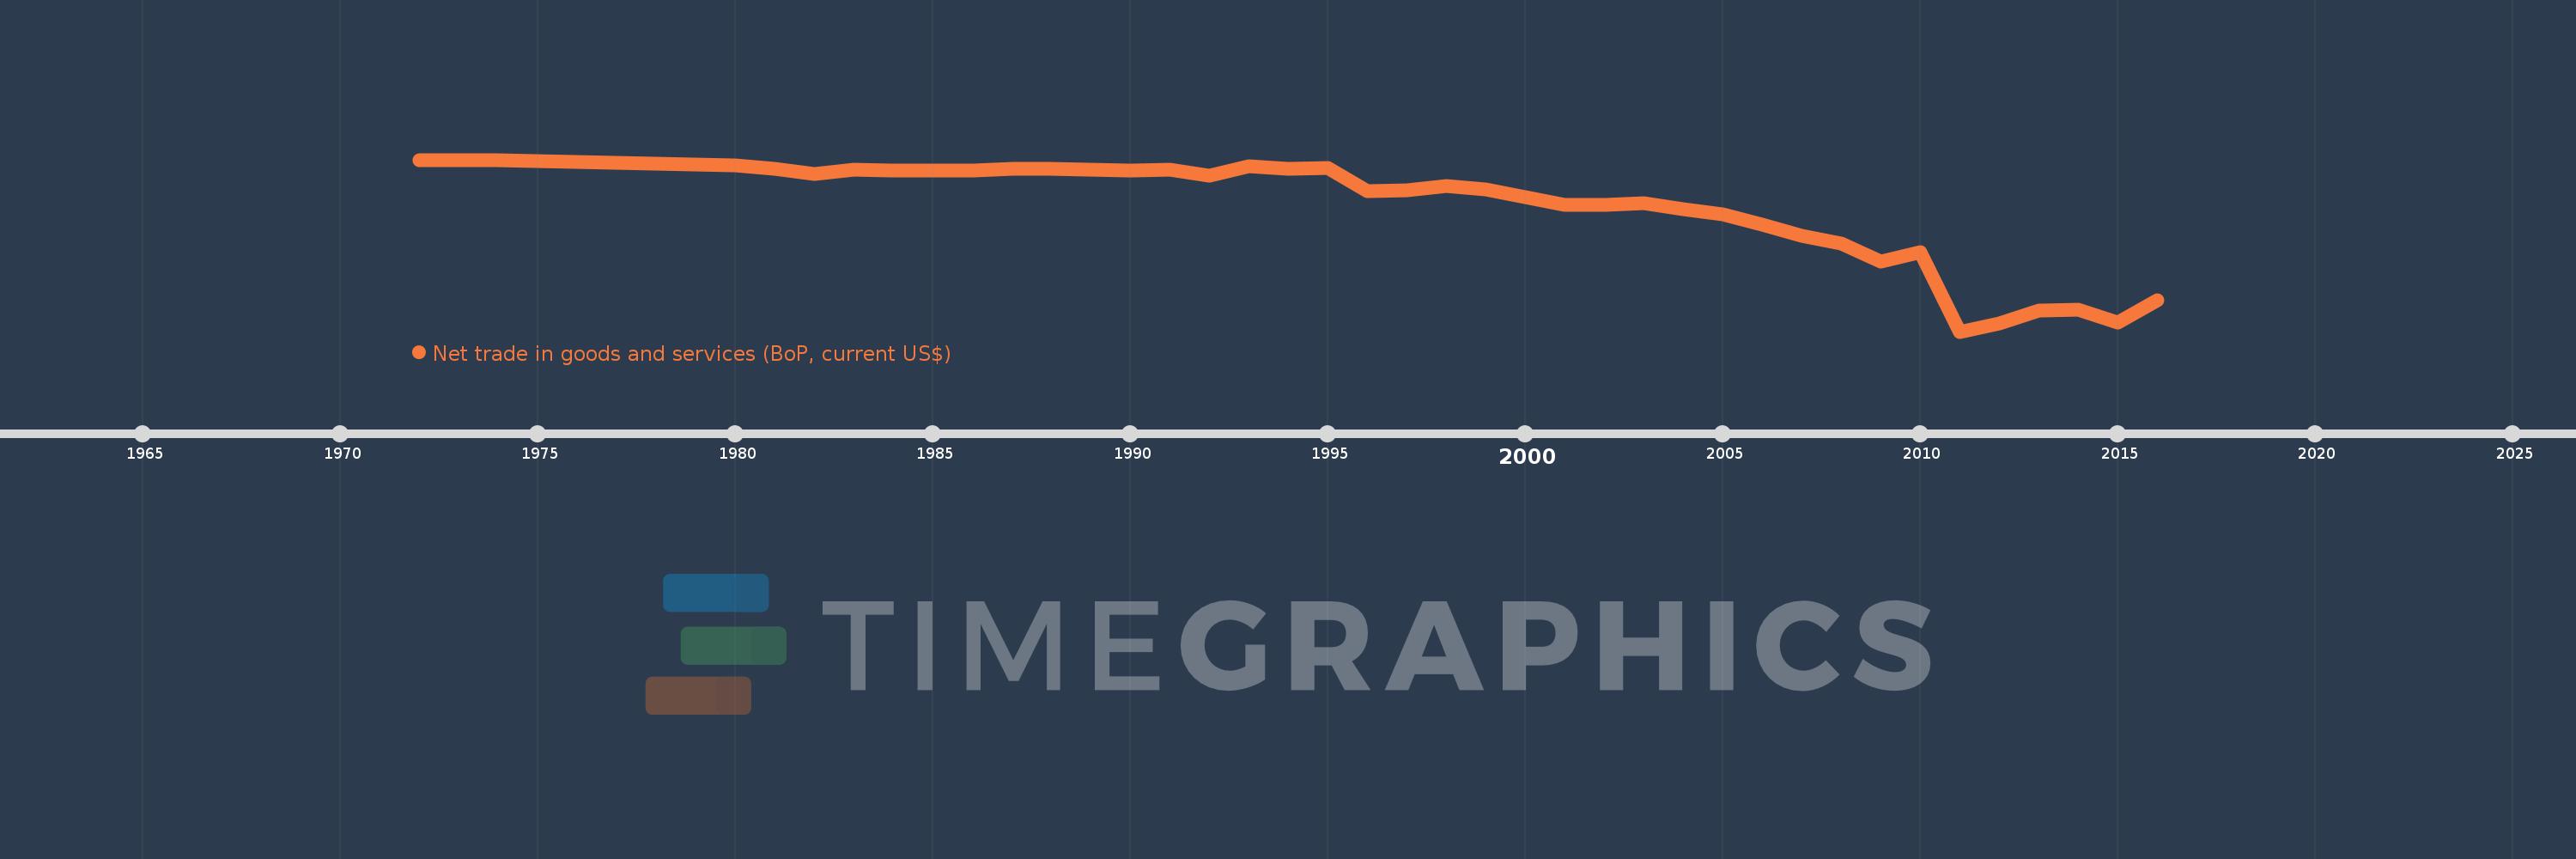
Net trade in goods and services (BoP, current US$)
2016,2015,2014,2013,2012,2011,2010,2009,2008,2007,2006,2005,2004,2003,2002,2001,2000,1999,1998,1997,1996,1995,1994,1993,1992,1991,1990,1989,1988,1987,1986,1985,1984,1983,1982,1981,1980,1979,1978,1977,1976,1975,1974,1973,1972
This statistics in other country:
AfghanistanAlbaniaAlgeriaAngolaAntigua and BarbudaArgentinaArmeniaArubaAustraliaAustriaAzerbaijanBahamas, TheBahrainBangladeshBarbadosBelarusBelgiumBelizeBeninBermudaBhutanBoliviaBosnia and HerzegovinaBotswanaBrazilBrunei DarussalamBulgariaBurkina FasoBurundiCabo VerdeCambodiaCameroonCanadaCentral African RepublicChadChileChinaColombiaComorosCongo, Dem. Rep.Congo, Rep.Costa RicaCote d'IvoireCroatiaCuracaoCyprusCzech RepublicDenmarkDjiboutiDominicaDominican RepublicEcuadorEgypt, Arab Rep.El SalvadorEquatorial GuineaEritreaEstoniaEthiopiaEuro areaFaroe IslandsFijiFinlandFranceFrench PolynesiaGabonGambia, TheGeorgiaGermanyGhanaGreeceGrenadaGuatemalaGuineaGuinea-BissauGuyanaHaitiHondurasHong Kong SAR, ChinaHungaryIcelandIndiaIndonesiaIran, Islamic Rep.IraqIrelandIsraelItalyJamaicaJapanJordanKazakhstanKenyaKiribatiKorea, Rep.KosovoKuwaitKyrgyz RepublicLao PDRLatviaLebanonLesothoLiberiaLibyaLithuaniaLuxembourgMacao SAR, ChinaMacedonia, FYRMadagascarMalawiMalaysiaMaldivesMaliMaltaMarshall IslandsMauritaniaMauritiusMexicoMicronesia, Fed. Sts.MoldovaMongoliaMontenegroMoroccoMozambiqueMyanmarNamibiaNepalNetherlandsNew CaledoniaNew ZealandNicaraguaNigerNigeriaNorwayOmanPakistanPalauPanamaPapua New GuineaParaguayPeruPhilippinesPolandPortugalQatarRomaniaRussian FederationRwandaSamoaSao Tome and PrincipeSaudi ArabiaSenegalSerbiaSeychellesSierra LeoneSingaporeSint Maarten (Dutch part)Slovak RepublicSloveniaSolomon IslandsSouth AfricaSouth SudanSpainSri LankaSt. Kitts and NevisSt. LuciaSt. Vincent and the GrenadinesSudanSurinameSwazilandSwedenSwitzerlandSyrian Arab RepublicTajikistanTanzaniaThailandTimor-LesteTogoTongaTrinidad and TobagoTunisiaTurkeyTuvaluUgandaUkraineUnited KingdomUnited StatesUruguayVanuatuVenezuela, RBVietnamWest Bank and GazaYemen, Rep.ZambiaZimbabwe Timeline:
This timeline shows a graph from 1972 to 2016 of Haiti. No data until 1971. Number of actual observations by date: 45.
Source name:
World Development Indicators
Source organization:
International Monetary Fund, Balance of Payments Statistics Yearbook and data files.
Categories, topics:
Economy & Growth, Trade
Last updated:
apr 23, 2017
Indicators value changes by year
Minimum:
-3.271 bln
jan 1, 2011
Maximum:
-10.84 mln
jan 1, 1972
At the date of observation
Value
Absolute change
Change from previous value
jan 1, 1972
-10.84 mln
-10.84 mln
0.0%
jan 1, 1973
-15.94 mln
-5.1 mln
47.05%
jan 1, 1974
-17.98 mln
-2.04 mln
12.8%
jan 1, 1975
-38.86 mln
-20.88 mln
116.13%
jan 1, 1976
-53.5 mln
-14.64 mln
37.67%
jan 1, 1977
-70.76 mln
-17.26 mln
32.26%
jan 1, 1978
-88.96 mln
-18.2 mln
25.72%
jan 1, 1979
-97.86 mln
-8.9 mln
10.0%
jan 1, 1980
-115.02 mln
-17.16 mln
17.54%
jan 1, 1981
-175.28 mln
-60.26 mln
52.39%
jan 1, 1982
-275.08 mln
-99.8 mln
56.94%
jan 1, 1983
-196.2 mln
+78.88 mln
-28.68%
jan 1, 1984
-207.38 mln
-11.18 mln
5.7%
jan 1, 1985
-207.92 mln
-540.0K
0.26%
jan 1, 1986
-219.9 mln
-11.98 mln
5.76%
jan 1, 1987
-181.42 mln
+38.48 mln
-17.5%
jan 1, 1988
-181.3 mln
+120.0K
-0.07%
jan 1, 1989
-206.12 mln
-24.82 mln
13.69%
jan 1, 1990
-211.36 mln
-5.24 mln
2.54%
jan 1, 1991
-196.6 mln
+14.76 mln
-6.98%
jan 1, 1992
-307.72 mln
-111.12 mln
56.52%
jan 1, 1993
-135.84 mln
+171.88 mln
-55.86%
jan 1, 1994
-174.63 mln
-38.79 mln
28.56%
jan 1, 1995
-168.39 mln
+6.24 mln
-3.57%
jan 1, 1996
-609.3 mln
-440.91 mln
261.84%
jan 1, 1997
-590.31 mln
+18.99 mln
-3.12%
jan 1, 1998
-512.0 mln
+78.31 mln
-13.27%
jan 1, 1999
-566.74 mln
-54.74 mln
10.69%
jan 1, 2000
-720.86 mln
-154.12 mln
27.19%
jan 1, 2001
-865.02 mln
-144.16 mln
20.0%
jan 1, 2002
-871.67 mln
-6.65 mln
0.77%
jan 1, 2003
-828.94 mln
+42.73 mln
-4.9%
jan 1, 2004
-947.15 mln
-118.21 mln
14.26%
jan 1, 2005
-1.049 bln
-101.8 mln
10.75%
jan 1, 2006
-1.248 bln
-198.85 mln
18.96%
jan 1, 2007
-1.452 bln
-204.65 mln
16.4%
jan 1, 2008
-1.605 bln
-152.81 mln
10.52%
jan 1, 2009
-1.937 bln
-331.318 mln
20.64%
jan 1, 2010
-1.77 bln
+166.366 mln
-8.59%
jan 1, 2011
-3.271 bln
-1.501 bln
84.78%
jan 1, 2012
-3.122 bln
+149.187 mln
-4.56%
jan 1, 2013
-2.868 bln
+254.24 mln
-8.14%
jan 1, 2014
-2.853 bln
+14.983 mln
-0.52%
jan 1, 2015
-3.1 bln
-247.903 mln
8.69%
jan 1, 2016
-2.679 bln
+421.202 mln
-13.59%
Ranking of countries by current statistics by years


Comments: