29
/
en
AIzaSyAYiBZKx7MnpbEhh9jyipgxe19OcubqV5w
April 1, 2024
240791
Singapore
SGP
true
2
1
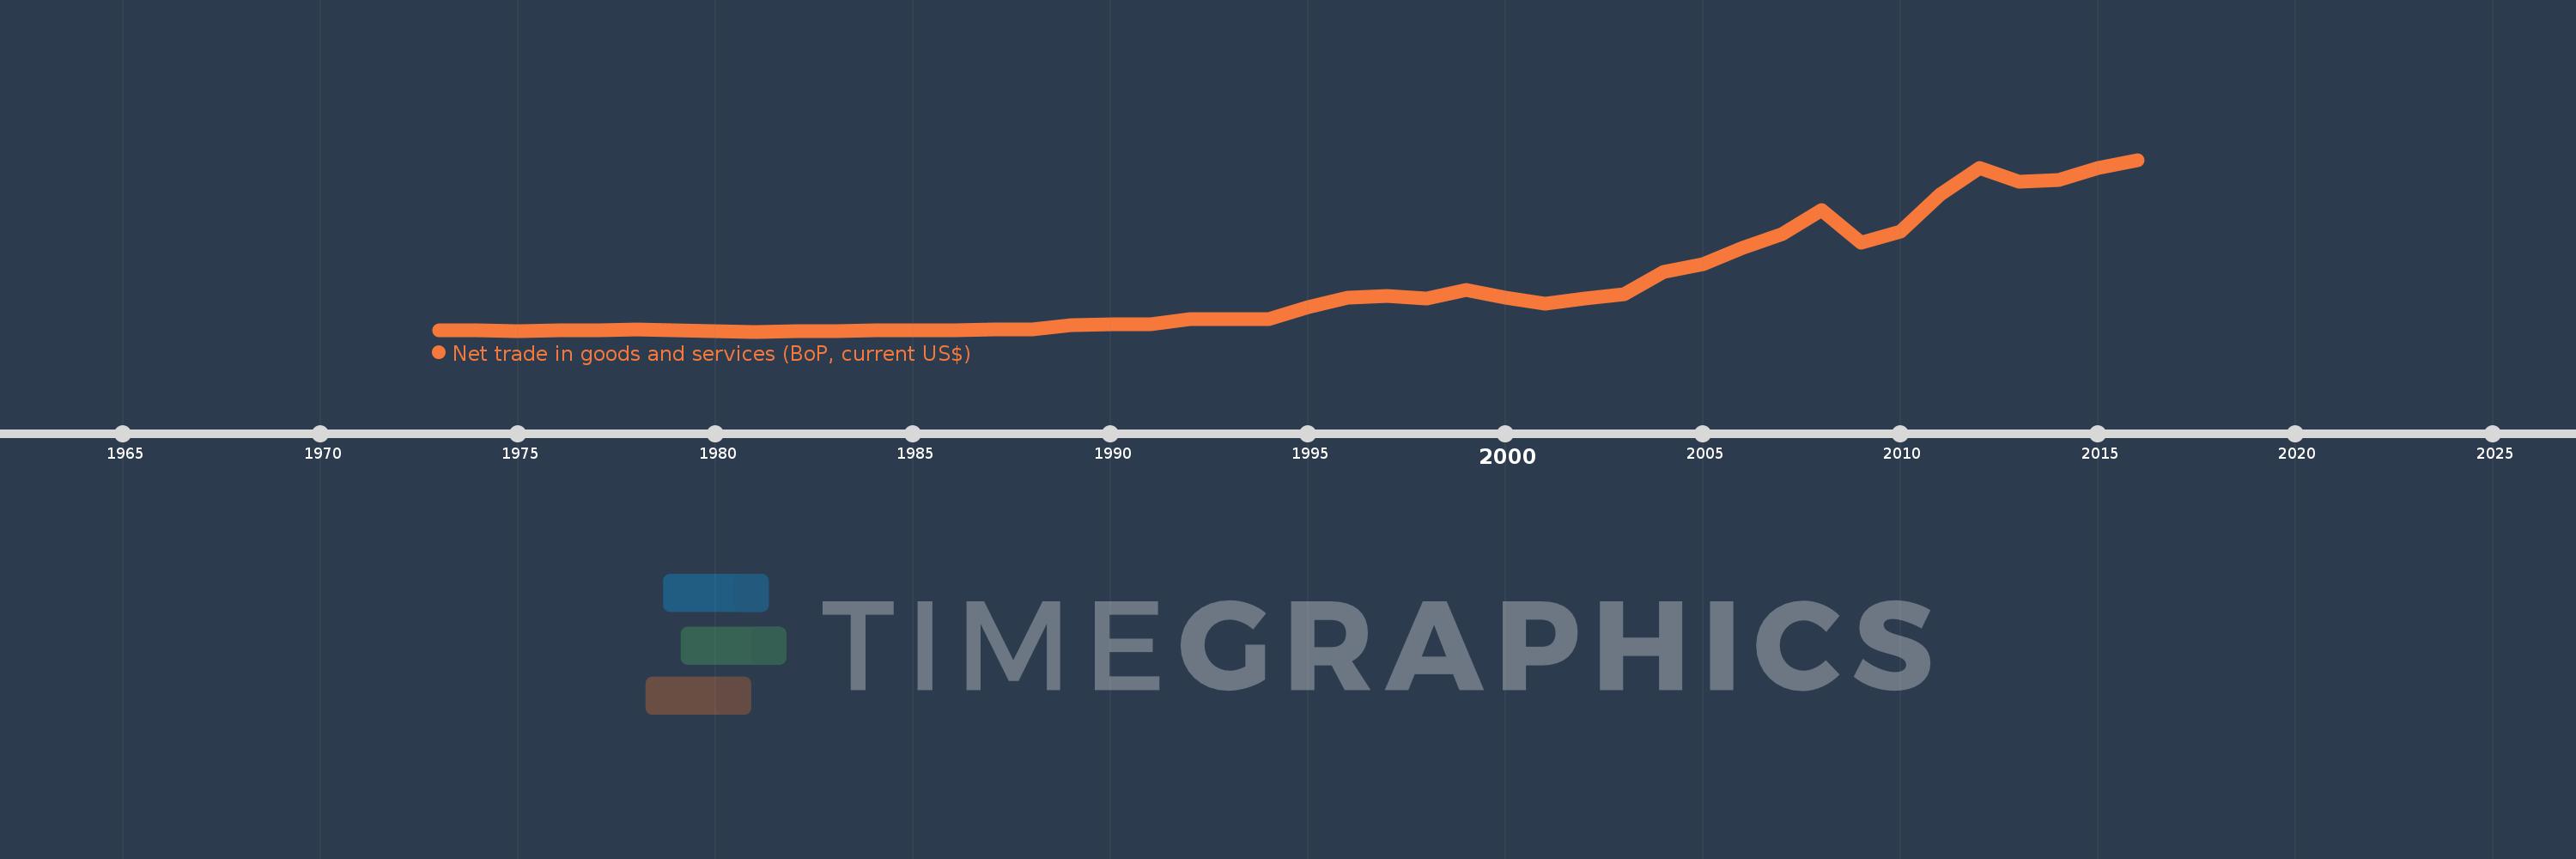
Net trade in goods and services (BoP, current US$)
2016,2015,2014,2013,2012,2011,2010,2009,2008,2007,2006,2005,2004,2003,2002,2001,2000,1999,1998,1997,1996,1995,1994,1993,1992,1991,1990,1989,1988,1987,1986,1985,1984,1983,1982,1981,1980,1979,1978,1977,1976,1975,1974,1973
This statistics in other country:
AfghanistanAlbaniaAlgeriaAngolaAntigua and BarbudaArgentinaArmeniaArubaAustraliaAustriaAzerbaijanBahamas, TheBahrainBangladeshBarbadosBelarusBelgiumBelizeBeninBermudaBhutanBoliviaBosnia and HerzegovinaBotswanaBrazilBrunei DarussalamBulgariaBurkina FasoBurundiCabo VerdeCambodiaCameroonCanadaCentral African RepublicChadChileChinaColombiaComorosCongo, Dem. Rep.Congo, Rep.Costa RicaCote d'IvoireCroatiaCuracaoCyprusCzech RepublicDenmarkDjiboutiDominicaDominican RepublicEcuadorEgypt, Arab Rep.El SalvadorEquatorial GuineaEritreaEstoniaEthiopiaEuro areaFaroe IslandsFijiFinlandFranceFrench PolynesiaGabonGambia, TheGeorgiaGermanyGhanaGreeceGrenadaGuatemalaGuineaGuinea-BissauGuyanaHaitiHondurasHong Kong SAR, ChinaHungaryIcelandIndiaIndonesiaIran, Islamic Rep.IraqIrelandIsraelItalyJamaicaJapanJordanKazakhstanKenyaKiribatiKorea, Rep.KosovoKuwaitKyrgyz RepublicLao PDRLatviaLebanonLesothoLiberiaLibyaLithuaniaLuxembourgMacao SAR, ChinaMacedonia, FYRMadagascarMalawiMalaysiaMaldivesMaliMaltaMarshall IslandsMauritaniaMauritiusMexicoMicronesia, Fed. Sts.MoldovaMongoliaMontenegroMoroccoMozambiqueMyanmarNamibiaNepalNetherlandsNew CaledoniaNew ZealandNicaraguaNigerNigeriaNorwayOmanPakistanPalauPanamaPapua New GuineaParaguayPeruPhilippinesPolandPortugalQatarRomaniaRussian FederationRwandaSamoaSao Tome and PrincipeSaudi ArabiaSenegalSerbiaSeychellesSierra LeoneSingaporeSint Maarten (Dutch part)Slovak RepublicSloveniaSolomon IslandsSouth AfricaSouth SudanSpainSri LankaSt. Kitts and NevisSt. LuciaSt. Vincent and the GrenadinesSudanSurinameSwazilandSwedenSwitzerlandSyrian Arab RepublicTajikistanTanzaniaThailandTimor-LesteTogoTongaTrinidad and TobagoTunisiaTurkeyTuvaluUgandaUkraineUnited KingdomUnited StatesUruguayVanuatuVenezuela, RBVietnamWest Bank and GazaYemen, Rep.ZambiaZimbabwe Timeline:
This timeline shows a graph from 1973 to 2016 of Singapore. No data until 1972. Number of actual observations by date: 44.
Source name:
World Development Indicators
Source organization:
International Monetary Fund, Balance of Payments Statistics Yearbook and data files.
Categories, topics:
Economy & Growth, Trade
Last updated:
apr 23, 2017
Indicators value changes by year
Minimum:
-1.027 bln
jan 1, 1981
Maximum:
78.666 bln
jan 1, 2016
At the date of observation
Value
Absolute change
Change from previous value
jan 1, 1973
-481.422 mln
-481.422 mln
0.0%
jan 1, 1974
-414.265 mln
+67.158 mln
-13.95%
jan 1, 1975
-827.702 mln
-413.438 mln
99.8%
jan 1, 1976
-579.851 mln
+247.852 mln
-29.94%
jan 1, 1977
-478.379 mln
+101.471 mln
-17.5%
jan 1, 1978
-167.254 mln
+311.125 mln
-65.04%
jan 1, 1979
-387.859 mln
-220.604 mln
131.9%
jan 1, 1980
-657.145 mln
-269.286 mln
69.43%
jan 1, 1981
-1.027 bln
-369.845 mln
56.28%
jan 1, 1982
-764.901 mln
+262.089 mln
-25.52%
jan 1, 1983
-665.413 mln
+99.488 mln
-13.01%
jan 1, 1984
-305.719 mln
+359.694 mln
-54.06%
jan 1, 1985
-513.341 mln
-207.622 mln
67.91%
jan 1, 1986
-384.519 mln
+128.822 mln
-25.09%
jan 1, 1987
58.326 mln
+442.845 mln
-115.17%
jan 1, 1988
39.506 mln
-18.82 mln
-32.27%
jan 1, 1989
1.794 bln
+1.754 bln
4.44K%
jan 1, 1990
2.497 bln
+703.084 mln
39.2%
jan 1, 1991
2.537 bln
+40.078 mln
1.61%
jan 1, 1992
4.589 bln
+2.053 bln
80.92%
jan 1, 1993
4.842 bln
+252.753 mln
5.51%
jan 1, 1994
4.552 bln
-289.767 mln
-5.98%
jan 1, 1995
10.5 bln
+5.948 bln
130.66%
jan 1, 1996
14.677 bln
+4.177 bln
39.78%
jan 1, 1997
15.628 bln
+950.997 mln
6.48%
jan 1, 1998
14.443 bln
-1.185 bln
-7.58%
jan 1, 1999
18.26 bln
+3.817 bln
26.43%
jan 1, 2000
14.521 bln
-3.739 bln
-20.48%
jan 1, 2001
11.78 bln
-2.741 bln
-18.88%
jan 1, 2002
14.473 bln
+2.693 bln
22.86%
jan 1, 2003
16.228 bln
+1.755 bln
12.13%
jan 1, 2004
26.706 bln
+10.478 bln
64.57%
jan 1, 2005
30.122 bln
+3.416 bln
12.79%
jan 1, 2006
38.007 bln
+7.885 bln
26.18%
jan 1, 2007
44.116 bln
+6.109 bln
16.07%
jan 1, 2008
55.482 bln
+11.367 bln
25.77%
jan 1, 2009
40.14 bln
-15.342 bln
-27.65%
jan 1, 2010
45.272 bln
+5.132 bln
12.79%
jan 1, 2011
62.459 bln
+17.187 bln
37.96%
jan 1, 2012
74.757 bln
+12.298 bln
19.69%
jan 1, 2013
68.374 bln
-6.382 bln
-8.54%
jan 1, 2014
69.412 bln
+1.037 bln
1.52%
jan 1, 2015
74.896 bln
+5.484 bln
7.9%
jan 1, 2016
78.666 bln
+3.77 bln
5.03%
Ranking of countries by current statistics by years


Comments: