29
/
en
AIzaSyAYiBZKx7MnpbEhh9jyipgxe19OcubqV5w
April 1, 2024
146176
Guinea
GIN
true
2
1
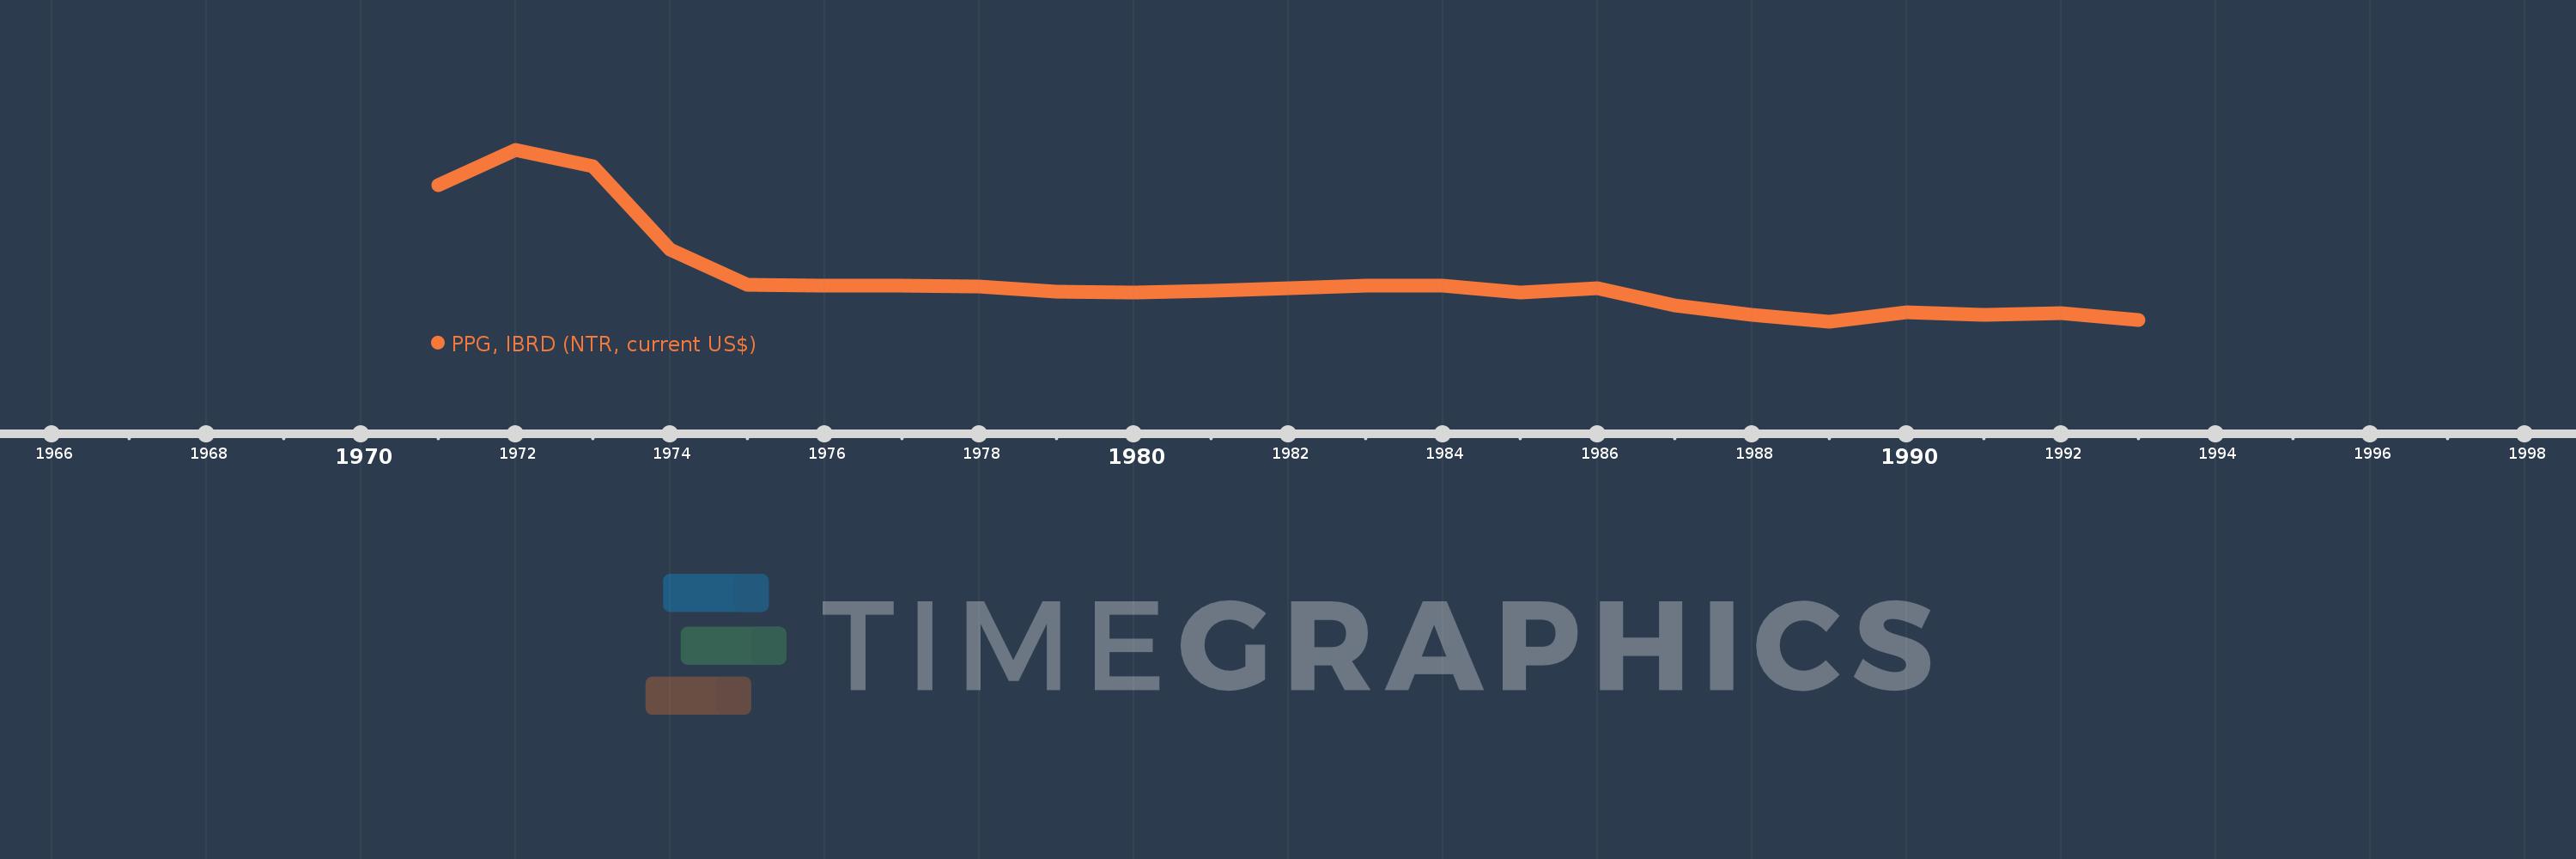
PPG, IBRD (NTR, current US$)
1993,1992,1991,1990,1989,1988,1987,1986,1985,1984,1983,1982,1981,1980,1979,1978,1977,1976,1975,1974,1973,1972,1971
This statistics in other country:
Timeline:
This timeline shows a graph from 1971 to 1993 of Guinea. No data until 1970. Number of actual observations by date: 23.
Source name:
World Development Indicators
Source organization:
World Bank, International Debt Statistics.
Categories, topics:
External Debt
Last updated:
apr 23, 2017
Indicators value changes by year
Minimum:
-15.772 mln
jan 1, 1989
Maximum:
22.084 mln
jan 1, 1972
At the date of observation
Value
Absolute change
Change from previous value
jan 1, 1971
14.292 mln
+14.292 mln
0.0%
jan 1, 1972
22.084 mln
+7.792 mln
54.52%
jan 1, 1973
18.579 mln
-3.505 mln
-15.87%
jan 1, 1974
267.0K
-18.312 mln
-98.56%
jan 1, 1975
-7.655 mln
-7.922 mln
-2.97K%
jan 1, 1976
-7.758 mln
-103.0K
1.35%
jan 1, 1977
-7.774 mln
-16.0K
0.21%
jan 1, 1978
-7.992 mln
-218.0K
2.8%
jan 1, 1979
-9.013 mln
-1.021 mln
12.78%
jan 1, 1980
-9.206 mln
-193.0K
2.14%
jan 1, 1981
-8.966 mln
+240.0K
-2.61%
jan 1, 1982
-8.418 mln
+548.0K
-6.11%
jan 1, 1983
-7.807 mln
+611.0K
-7.26%
jan 1, 1984
-7.83 mln
-23.0K
0.29%
jan 1, 1985
-9.35 mln
-1.52 mln
19.41%
jan 1, 1986
-8.363 mln
+987.0K
-10.56%
jan 1, 1987
-12.03 mln
-3.667 mln
43.85%
jan 1, 1988
-14.18 mln
-2.15 mln
17.87%
jan 1, 1989
-15.772 mln
-1.592 mln
11.23%
jan 1, 1990
-13.679 mln
+2.093 mln
-13.27%
jan 1, 1991
-14.165 mln
-486.0K
3.55%
jan 1, 1992
-13.837 mln
+328.0K
-2.32%
jan 1, 1993
-15.246 mln
-1.409 mln
10.18%
Ranking of countries by current statistics by years


Comments: