29
/
en
AIzaSyAYiBZKx7MnpbEhh9jyipgxe19OcubqV5w
April 1, 2024
96633
Burundi
BDI
true
2
1
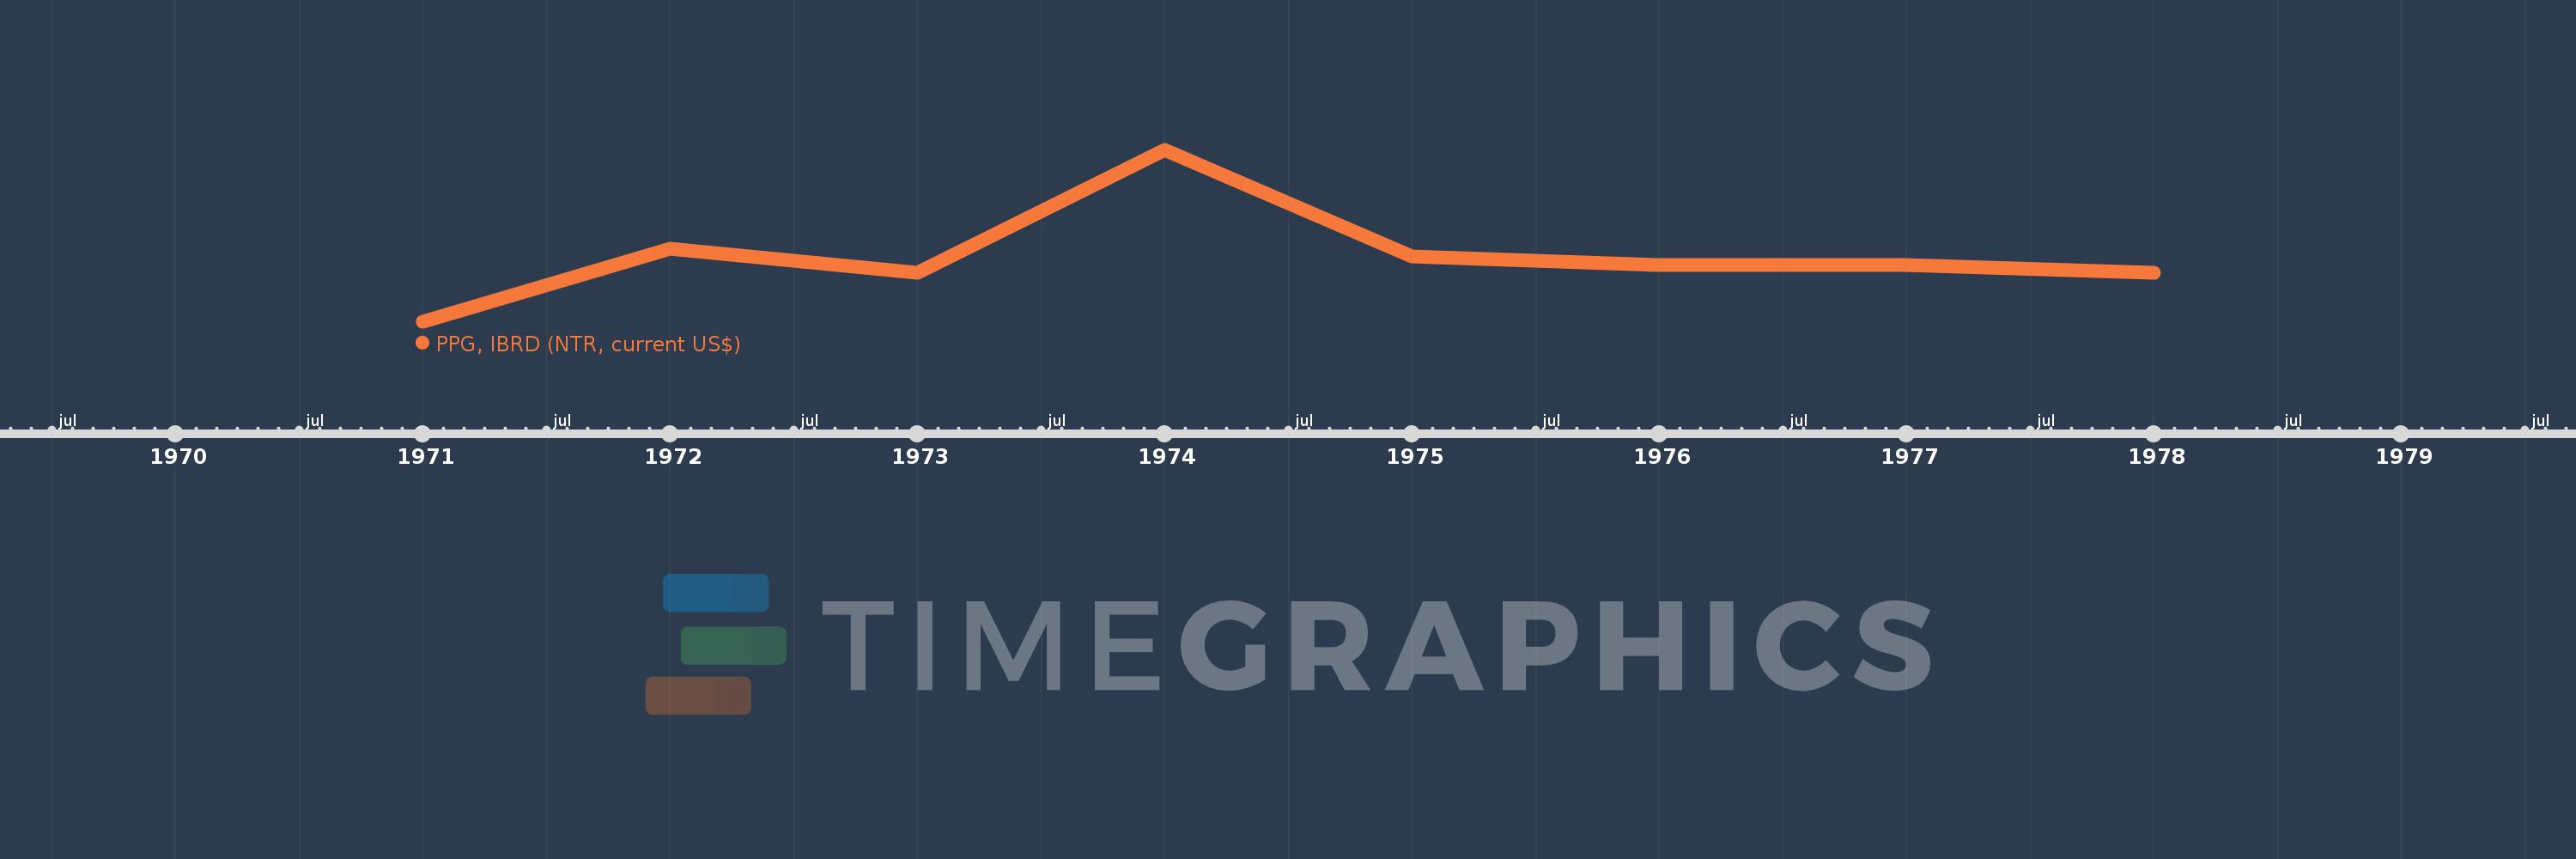
PPG, IBRD (NTR, current US$)
1978,1977,1976,1975,1974,1973,1972,1971
This statistics in other country:
Timeline:
This timeline shows a graph from 1971 to 1978 of Burundi. No data until 1970. Number of actual observations by date: 8.
Source name:
World Development Indicators
Source organization:
World Bank, International Debt Statistics.
Categories, topics:
External Debt
Last updated:
apr 23, 2017
Indicators value changes by year
Minimum:
-448.0K
jan 1, 1971
Maximum:
-427.0K
jan 1, 1974
At the date of observation
Value
Absolute change
Change from previous value
jan 1, 1971
-448.0K
-448.0K
0.0%
jan 1, 1972
-439.0K
+9.0K
-2.01%
jan 1, 1973
-442.0K
-3.0K
0.68%
jan 1, 1974
-427.0K
+15.0K
-3.39%
jan 1, 1975
-440.0K
-13.0K
3.04%
jan 1, 1976
-441.0K
-1000.0
0.23%
jan 1, 1977
-441.0K
0.0
0.0%
jan 1, 1978
-442.0K
-1000.0
0.23%
Ranking of countries by current statistics by years


Comments: