30
/
AIzaSyAYiBZKx7MnpbEhh9jyipgxe19OcubqV5w
April 1, 2024
146174
Guinea
GIN
true
2
1
PPG, IBRD (DOD, current US$)
1993,1992,1991,1990,1989,1988,1987,1986,1985,1984,1983,1982,1981,1980,1979,1978,1977,1976,1975,1974,1973,1972,1971
Public Timelines
FAQ
Menu
Public Timelines
FAQ
For education
For educational institutions
For teachers
For students
Open cabinet
Create
Close
Create a timeline
Public timelines
Library
FAQ
Download
Global statistics library
→
Guinea
→
PPG, IBRD (DOD, current US$)
This statistics in other country:
Albania
Algeria
Angola
Argentina
Armenia
Azerbaijan
Bangladesh
Belarus
Belize
Bolivia
Bosnia and Herzegovina
Botswana
Brazil
Bulgaria
Burundi
Cabo Verde
Cameroon
Chad
China
Colombia
Congo, Dem. Rep.
Congo, Rep.
Costa Rica
Cote d'Ivoire
Dominica
Dominican Republic
East Asia & Pacific (excluding high income)
Ecuador
Egypt, Arab Rep.
El Salvador
Ethiopia
Europe & Central Asia (excluding high income)
Fiji
Gabon
Georgia
Ghana
Grenada
Guatemala
Guinea
Guyana
Honduras
IDA only
India
Indonesia
Iran, Islamic Rep.
Jamaica
Jordan
Kazakhstan
Kenya
Kosovo
Latin America & Caribbean (excluding high income)
Lebanon
Lesotho
Liberia
Low & middle income
Low income
Lower middle income
Macedonia, FYR
Madagascar
Malawi
Malaysia
Mauritania
Mauritius
Mexico
Middle East & North Africa (excluding high income)
Middle income
Moldova
Montenegro
Morocco
Myanmar
Nicaragua
Nigeria
Pakistan
Panama
Papua New Guinea
Paraguay
Peru
Philippines
Romania
Russian Federation
Senegal
Serbia
Sierra Leone
South Africa
South Asia
Sri Lanka
St. Lucia
St. Vincent and the Grenadines
Sub-Saharan Africa (excluding high income)
Sudan
Swaziland
Syrian Arab Republic
Tanzania
Thailand
Togo
Tunisia
Turkey
Turkmenistan
Uganda
Ukraine
Upper middle income
Uzbekistan
Venezuela, RB
Vietnam
Zambia
Zimbabwe
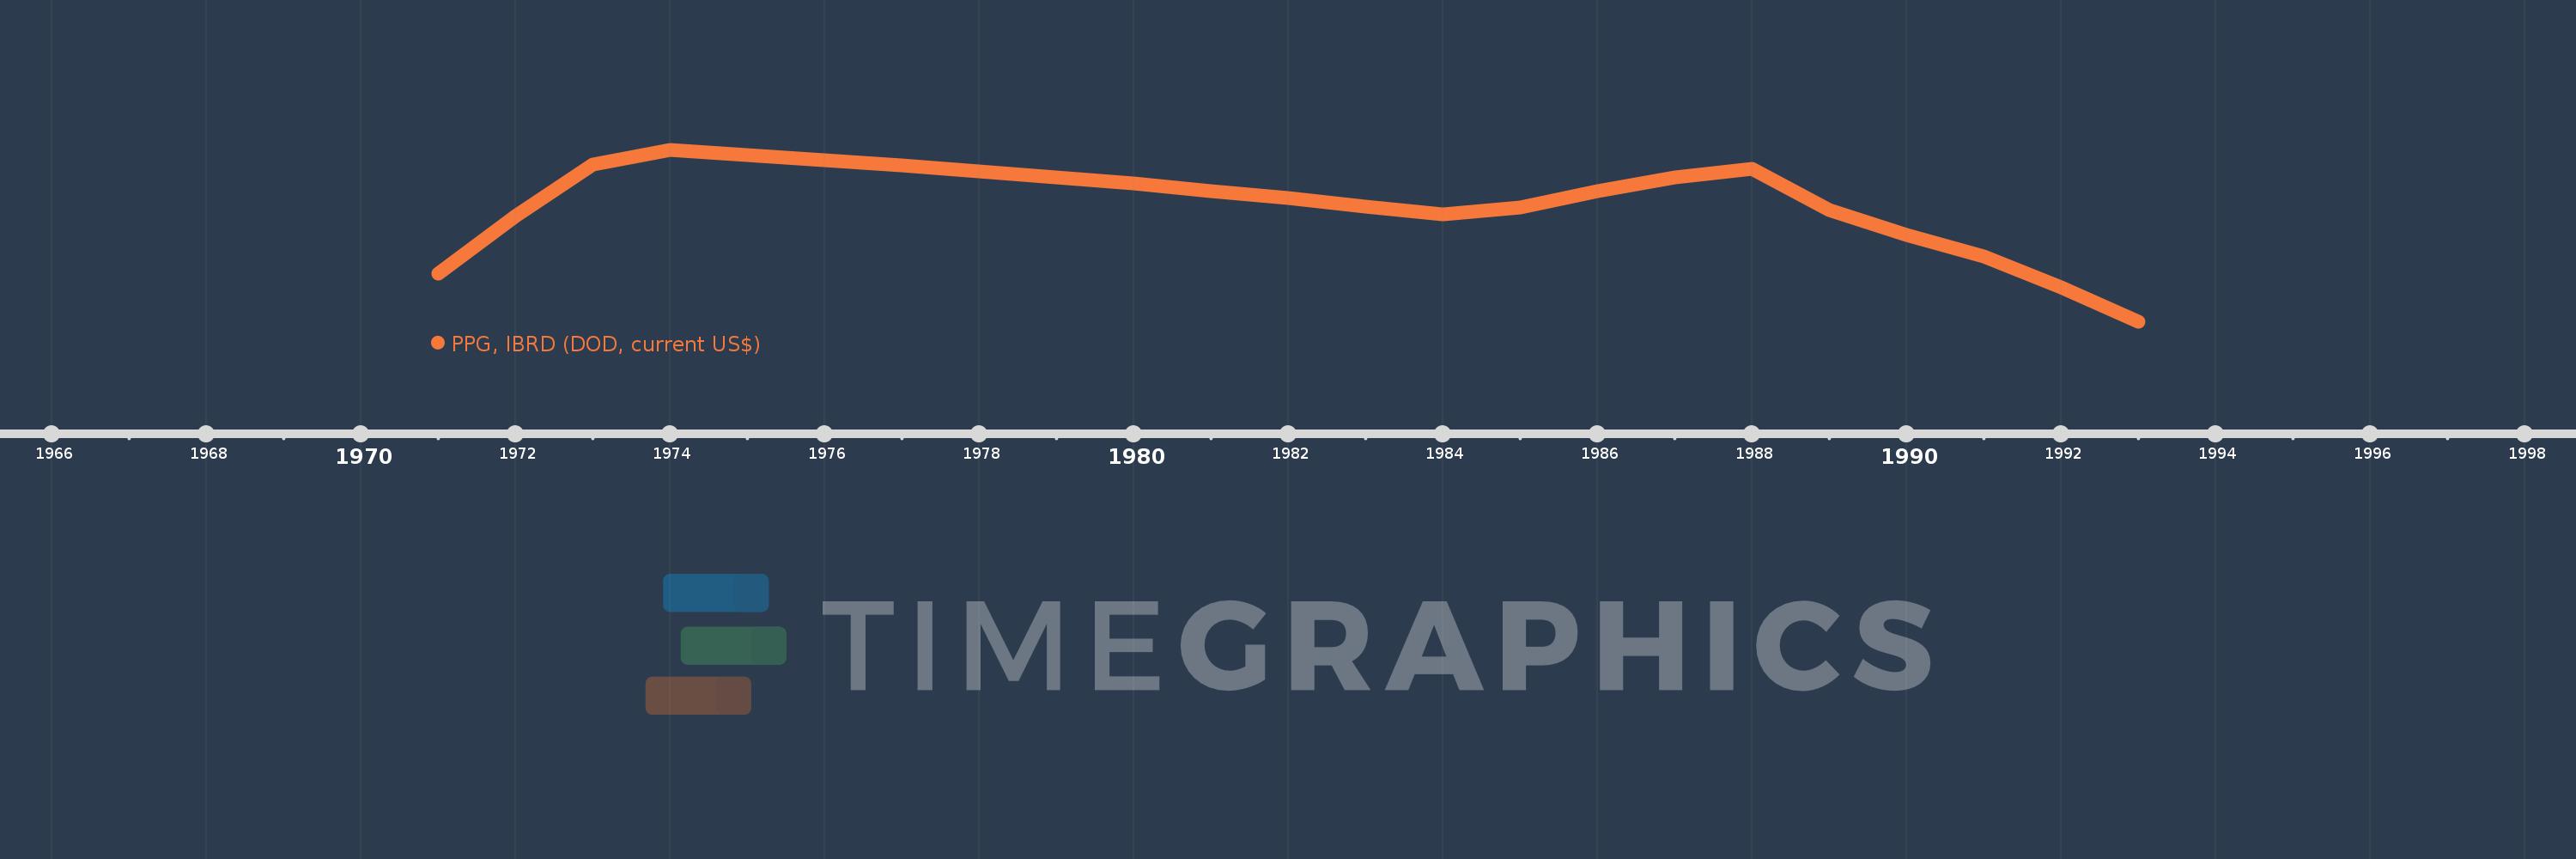
Timeline:
This timeline shows a graph from
1971
to
1993
of Guinea. No data until
1970
. Number of actual observations by date:
23
.
Source name:
World Development Indicators
Source organization:
World Bank, International Debt Statistics.
Categories, topics:
External Debt
Last updated:
apr 23, 2017
Indicators value changes by year
Meaning:
50.023 mln
Minimum:
0.0
jan 1, 1993
Maximum:
72.545 mln
jan 1, 1974
At the date of observation
Value
Absolute change
Change from the previous value
jan 1, 1971
20.405 mln
+20.405 mln
0.0%
jan 1, 1972
44.564 mln
+24.159 mln
118.4%
jan 1, 1973
66.665 mln
+22.101 mln
49.59%
jan 1, 1974
72.545 mln
+5.88 mln
8.82%
jan 1, 1975
70.55 mln
-1.995 mln
-2.75%
jan 1, 1976
68.415 mln
-2.135 mln
-3.03%
jan 1, 1977
66.135 mln
-2.28 mln
-3.33%
jan 1, 1978
63.705 mln
-2.43 mln
-3.67%
jan 1, 1979
61.11 mln
-2.595 mln
-4.07%
jan 1, 1980
58.345 mln
-2.765 mln
-4.52%
jan 1, 1981
55.395 mln
-2.95 mln
-5.06%
jan 1, 1982
52.245 mln
-3.15 mln
-5.69%
jan 1, 1983
48.88 mln
-3.365 mln
-6.44%
jan 1, 1984
45.295 mln
-3.585 mln
-7.33%
jan 1, 1985
48.411 mln
+3.116 mln
6.88%
jan 1, 1986
55.209 mln
+6.798 mln
14.04%
jan 1, 1987
61.063 mln
+5.854 mln
10.6%
jan 1, 1988
64.845 mln
+3.782 mln
6.19%
jan 1, 1989
47.433 mln
-17.412 mln
-26.85%
jan 1, 1990
36.909 mln
-10.524 mln
-22.19%
jan 1, 1991
27.763 mln
-9.146 mln
-24.78%
jan 1, 1992
14.634 mln
-13.129 mln
-47.29%
jan 1, 1993
0.0
-14.634 mln
-100.0%
Ranking of countries by current statistics by years
About & Feedback
Terms
Privacy
Library
2024
©
Time.Graphics
Support 24/7
Cabinet
Get premium
Donate
The service accepts bank transfer (ACH, Wire) or cards (Visa, MasterCard, etc). Processed by Stripe.
Secured with SSL
Excellent (Trustpilot Reviews)
Based on 115+ reviews
Write your own review on
Trustpilot.com
