29
/
en
AIzaSyAYiBZKx7MnpbEhh9jyipgxe19OcubqV5w
April 1, 2024
81084
Belarus
BLR
true
2
1
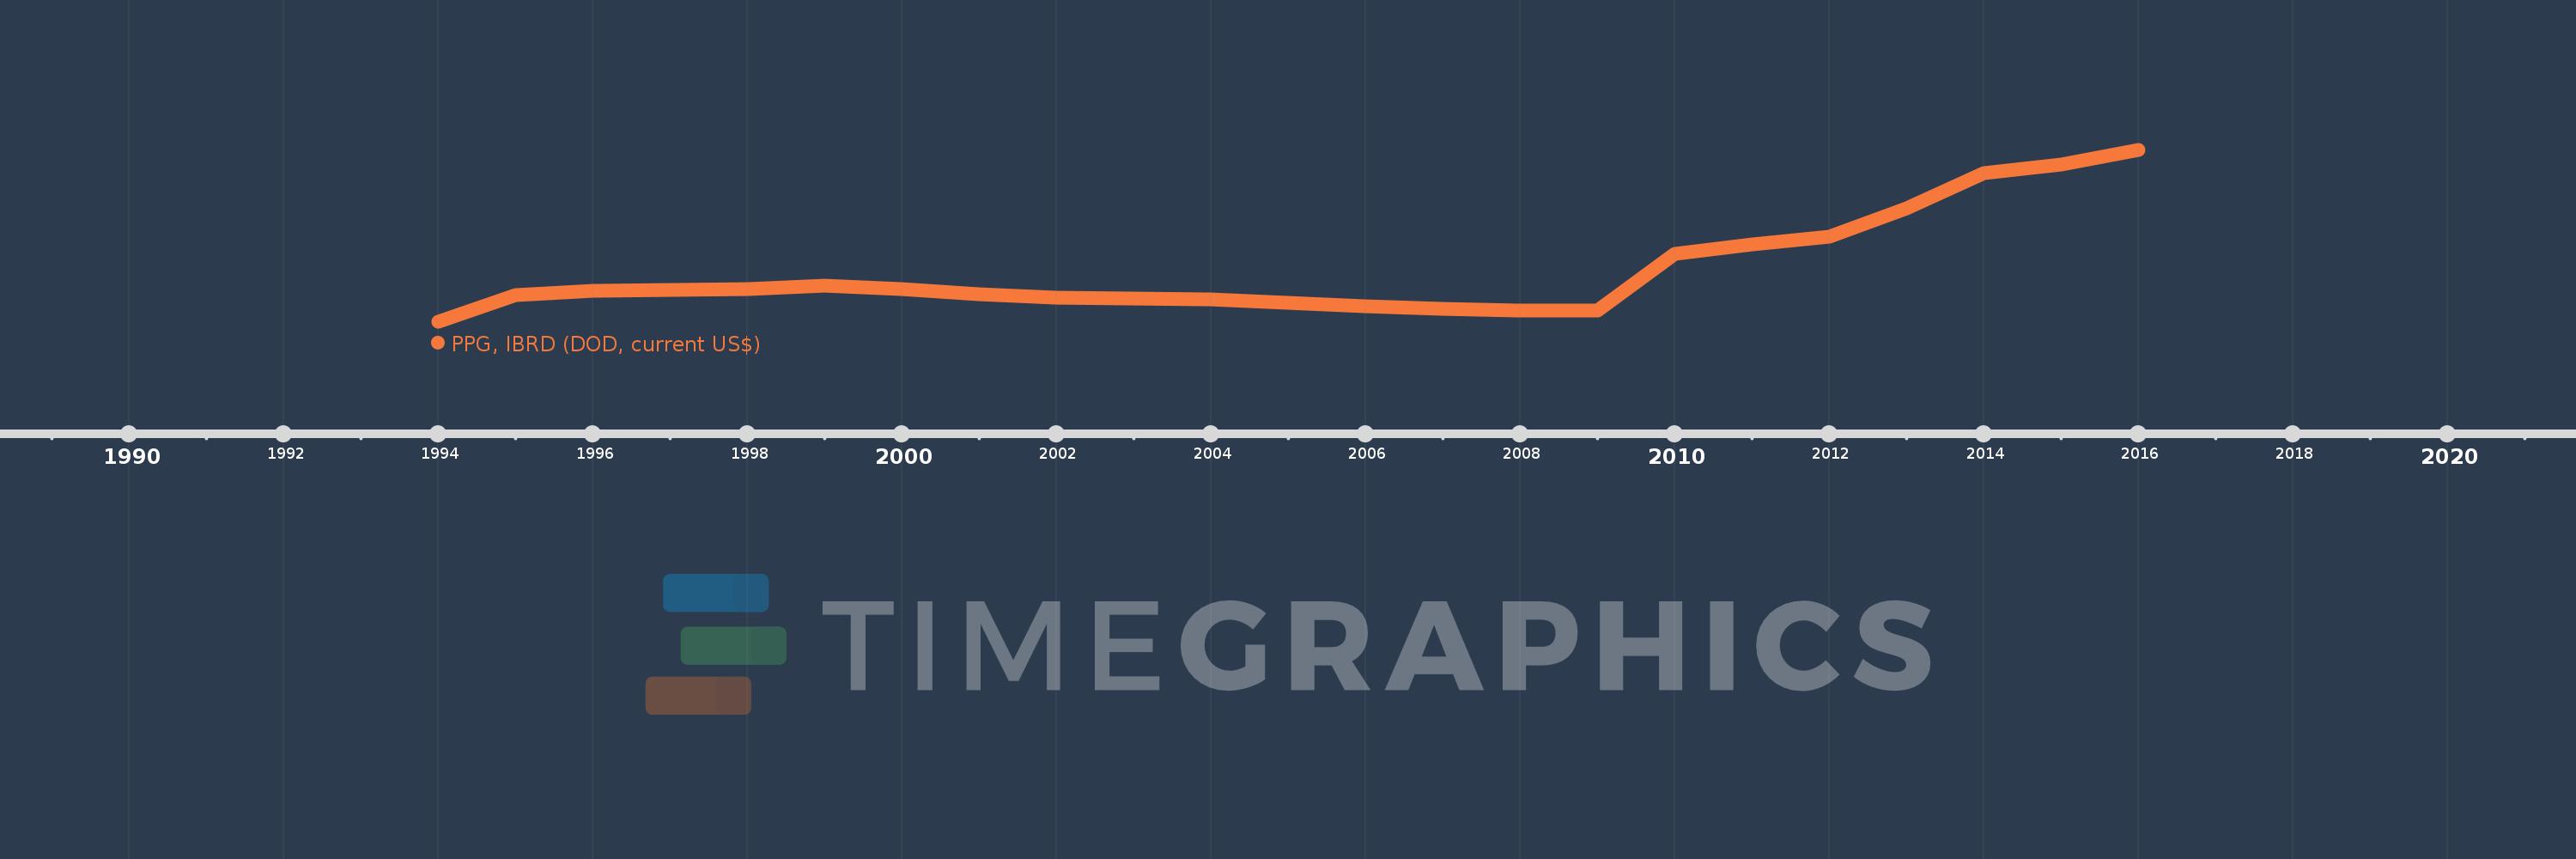
PPG, IBRD (DOD, current US$)
2016,2015,2014,2013,2012,2011,2010,2009,2008,2007,2006,2005,2004,2003,2002,2001,2000,1999,1998,1997,1996,1995,1994
This statistics in other country:
Timeline:
This timeline shows a graph from 1994 to 2016 of Belarus. No data until 1993. Number of actual observations by date: 23.
Source name:
World Development Indicators
Source organization:
World Bank, International Debt Statistics.
Categories, topics:
External Debt
Last updated:
apr 23, 2017
Indicators value changes by year
Minimum:
100.0K
jan 1, 1994
Maximum:
641.812 mln
jan 1, 2016
At the date of observation
Value
Absolute change
Change from previous value
jan 1, 1994
100.0K
+100.0K
0.0%
jan 1, 1995
101.043 mln
+100.943 mln
100.94K%
jan 1, 1996
115.533 mln
+14.49 mln
14.34%
jan 1, 1997
120.744 mln
+5.211 mln
4.51%
jan 1, 1998
123.754 mln
+3.01 mln
2.49%
jan 1, 1999
134.887 mln
+11.133 mln
9.0%
jan 1, 2000
122.328 mln
-12.559 mln
-9.31%
jan 1, 2001
105.154 mln
-17.174 mln
-14.04%
jan 1, 2002
91.369 mln
-13.785 mln
-13.11%
jan 1, 2003
89.247 mln
-2.122 mln
-2.32%
jan 1, 2004
83.684 mln
-5.563 mln
-6.23%
jan 1, 2005
73.031 mln
-10.653 mln
-12.73%
jan 1, 2006
58.67 mln
-14.361 mln
-19.66%
jan 1, 2007
49.7 mln
-8.97 mln
-15.29%
jan 1, 2008
42.311 mln
-7.389 mln
-14.87%
jan 1, 2009
42.321 mln
+10.0K
0.02%
jan 1, 2010
255.63 mln
+213.309 mln
504.03%
jan 1, 2011
291.336 mln
+35.706 mln
13.97%
jan 1, 2012
317.548 mln
+26.212 mln
9.0%
jan 1, 2013
424.328 mln
+106.78 mln
33.63%
jan 1, 2014
556.657 mln
+132.329 mln
31.19%
jan 1, 2015
589.814 mln
+33.157 mln
5.96%
jan 1, 2016
641.812 mln
+51.998 mln
8.82%
Ranking of countries by current statistics by years


Comments: